
Fig. 3.
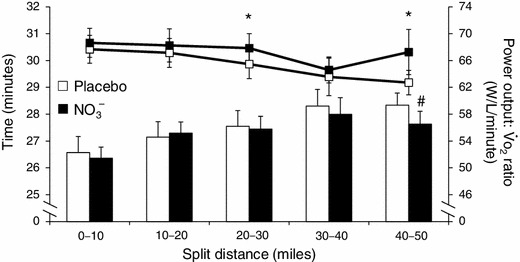
Influence of dietary nitrate (black symbols) and placebo (white symbols) supplementation on 50-mile cycling time trial performance. The lines in the upper part of the figure show the ratio of power output to and the bars in the lower part of the figure show the split times taken to complete consecutive 10-mile splits. The power output to ratio was higher for the 20- to 30-mile (*p = 0.05) and 40- 50-mile (*p < 0.05) splits, and the 40- to 50-mile split was completed in a faster time (# p < 0.05) following nitrate supplementation compared with placebo. However, there was no significant difference in overall performance between treatments (beetroot juice 136.7 ± 5.6 vs. placebo 137.9 ± 6.4 min). Values are shown as mean ± SD. oxygen uptake