
Figure 2.
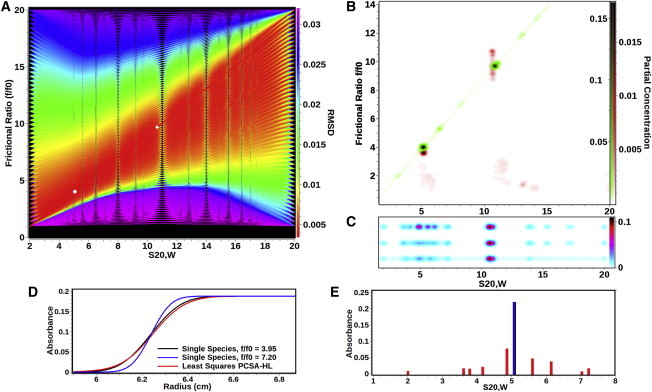
Comparison between different analysis methods applied to the experimental data listed in Table 2. (A) RMSD heat map for a high-resolution grid using the straight-line (SL) PCSA. (Red lines) Solutions with the lowest RMSD; (purple lines) poor selections for this system. (The BFM is the red line that intercepts the two white circles.) (White circles) Most prominent solutes found for this system in the BFM. (B) Genetic algorithm Monte Carlo analysis (red) overlaid with the straight-line PCSA Monte Carlo analysis (green). The major components are essentially congruent, exhibiting significant difference in anisotropy. The PCSA fit constrains the solution to a single point, while the genetic algorithm analysis is multivalued for the frictional ratio of the larger species. (C) PCSA horizontal-line parameterization (PCSA-HL) for the same data as analyzed in panel B. All fits have the same frictional ratio average of 7.20, but are shown offset for clarity: unregularized (top), TR with L-curve criterion α-value = 0.51 (center), 100-iteration Monte Carlo analysis (bottom). For all fits, the smaller species is significantly broadened in the s-domain through introduction of false positives as explained in panels D and E. One-dimensional histogram plots for the same data are shown for each plot in Fig. S1 in the Supporting Material. (D) Boundary shapes of two solutes with identical s-values of 5.07 s (equal to the smaller DNA species shown in panel B), but different f/f0; (blue) f/f0 = 7.20, the average value obtained in the PCSA-HL, and (black) f/f0 = 3.95, which is equal to the true f/f0 value of the smaller DNA species. (Red curve) Fit of the (black) curve obtained by PCSA-HL when f/f0 is constrained to 7.20. (The red curve clearly has a much smaller deviation from the black curve than the blue curve, because the red curve satisfies the least-squares condition and produces a lower RMSD at the expense of introducing multiple artifactual solutes.) (E) Solutes obtained in the PCSA-HL fit of the (black) curve shown in panel D. (Black/blue position) The true single species position and partial concentration. All red bars, corresponding to the unregularized fit shown in the red curve in panel D, represent incorrect sedimentation coefficients, frictional ratios, and partial concentrations. This condition is encountered whenever a mixture heterogeneous in frictional ratio is fitted with the PCSA-HL or the C(s) method. As shown in panel B, this problem is completely eliminated by the PCSA-SL solution.