
Figure 4.
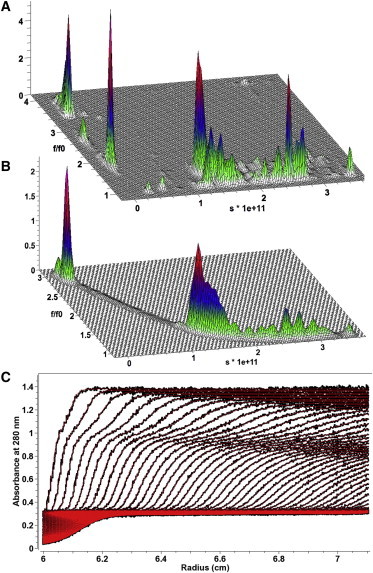
Sedimentation velocity analysis of polymerizing clathrin triskelia in a clathrin assembly reaction. (A) Two-dimensional spectrum analysis. At low sedimentation coefficients, highly anisotropic triskelia monomers and dimers, as well as incompletely formed clathrin cage fragments are apparent, whereas at higher sedimentation coefficients the more spherical, fully formed cages are apparent. (B) Parametrically constrained spectrum analysis of the same data as shown in panel A using a decreasing sigmoidal functional form. The frictional ratio versus sedimentation coefficient distribution observed mirrors the information observed in the 2DSA analysis, but all values are constrained to a single sedimentation-frictional ratio pair. (C) Experimental data (black) overlaid with the fitted PCSA solution (red) for the clathrin assembly reaction mixture. The data demonstrate a near-perfect fit. The PCSA analysis resulted in a BFM with an RMSD of 5.469 × 10⁻³, whereas the unconstrained 2DSA-Monte Carlo analysis resulted in a lower RMSD of 5.437 × 10⁻³.