
Figure 5.
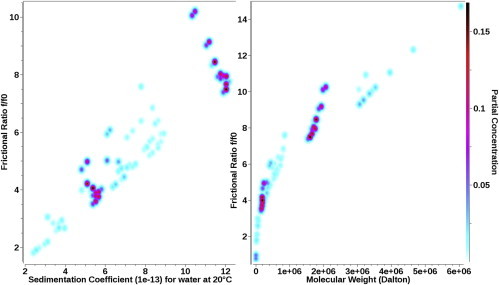
PCSA analysis of a mixture of two linear dsDNA fragments in 1, 5, 7, 10, 20, 50, and 150 mM NaCl using a straight-line function. Lower salt concentration results in a steeper slope, indicating a higher anisotropy. The dependence of the slope on salt concentration is shown in Fig. 6. To see this figure in color, go online.