
Figure 6.
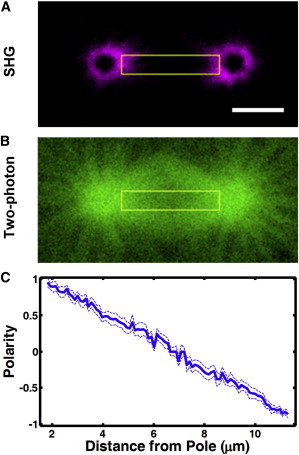
Analysis of MT polarity in the first mitotic spindle in a C. elegans embryo. SHG (A) and TP (B) images of the spindle. The yellow rectangle specifies the region of interest. Scale bar, 5 μm. (C) Polarity profile extracted from SHG and TP images based on the proposed model in blue (mean ± SE). To see this figure in color, go online.