
Figure 6.
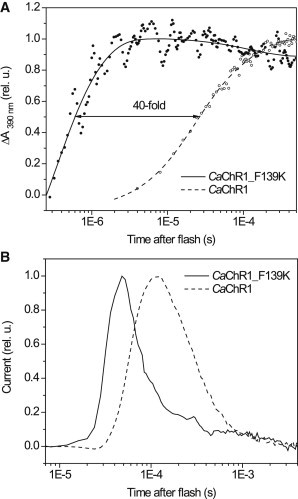
(A) Absorbance changes monitored at 390 nm in WT CaChR1 (open circles, dashed line) and its F139K mutant (solid circles, solid line) in response to a 6-ns laser flash (532 nm). The arrow shows the difference in the time of the half-maximal amplitude of the signal. (B) Outward proton transfer currents recorded upon laser excitation from WT CaChR1 (dashed line) and its F139K mutant (solid line) expressed in HEK293 cells at the reversal potential for channel currents to minimize their contribution to the signal kinetics. The current kinetics is limited by the time resolution of the measuring system. In both panels the signals were normalized to their maximal values.