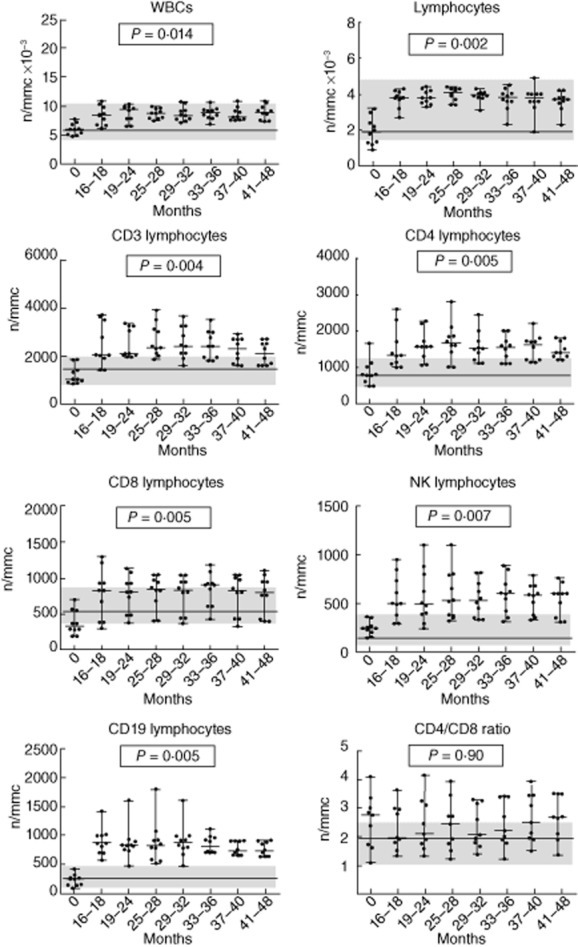
Figure 3.

Trend of white blood cells, lymphocytes and lymphocyte subsets in long-term natalizumab-treated group during 41/48-month follow-up. P-values refer to the analysis of variance test for repeated measures; the line and the grey areas represent median value and range of healthy controls.
