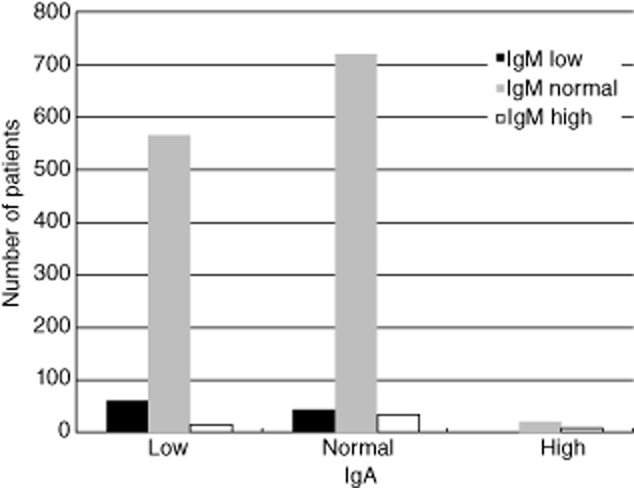
Figure 2.

Immunoglobulin (Ig)A and IgM levels at presentation of the children in the ‘total primary hypogammaglobulinaemia’ group. Patients are divided into different groups based on their levels of IgA and IgM at presentation: IgA low (left), IgA normal (middle), IgA high (right), IgM low (black), IgM normal (grey) and IgM high (white).
