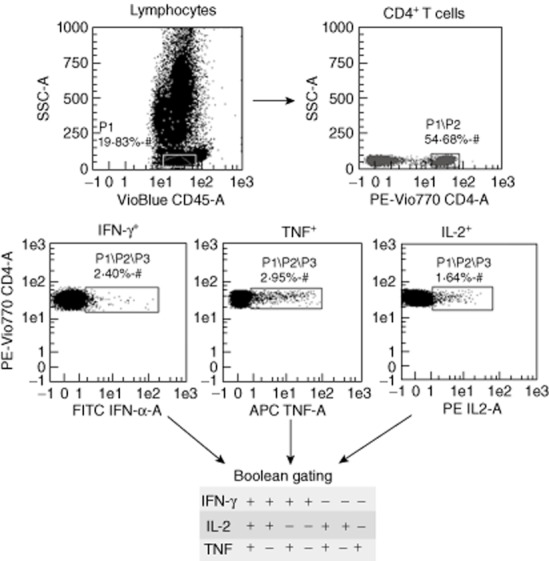
Figure 1.

Characterization of distinct population of T cell responses using flow cytometry. Representative flow cytometry plot of cytokine production of CD4+ T cells from patients with latent tuberculosis infection (LTBI). Stimulated CD4+ T cells were categorized into cells expressing interferon (IFN)-γ, interleukin (IL)-2 and tumour necrosis factor (TNF). Boolean gate analysis was used to study the frequency of the seven CD4+ T cell subsets, each expressing one of the possible combinations of IFN-γ, IL-2 and TNF.
