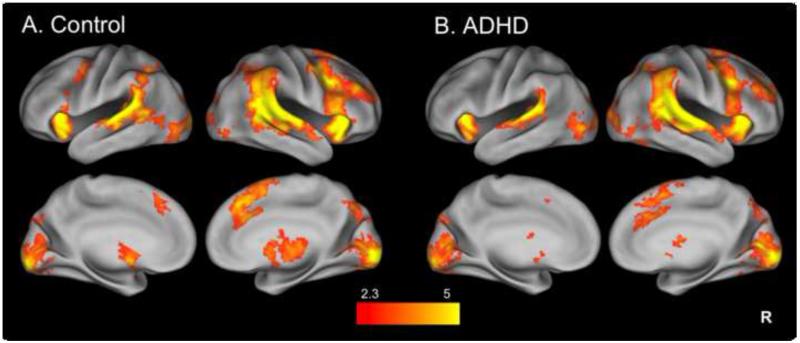
Fig. 3.
Separate group maps of StopInhibit-Go activation. Stopping-related activation in controls (A) and adult ADHD (B) groups alone. Statistical maps are corrected for whole-brain multiple comparisons and were projected onto an average cortical surface using CARET (R = Right). The color represents the z-score.

