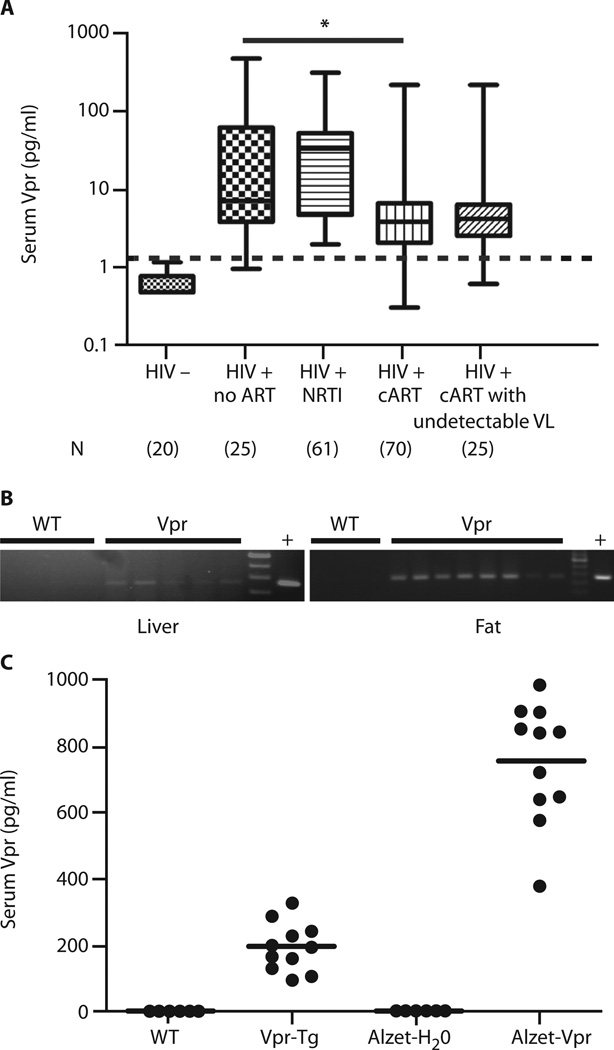
Fig. 1. Vpr in HIV patients and mouse models.
(A) Box-and-whisker plots of serum Vpr concentrations in HIV-negative persons and four HIV-infected groups: ART-naïve, on NRTI only, on cART, and on cART with undetectable VL. Median Vpr concentrations in patients: ART-naïve = 7.0 pg/ml; NRTI only = 32.0 pg/ml; cART = 3.9 pg/ml; cART with undetectable VL = 4.2 pg/ml. Whiskers indicate minimum and maximum of all data. Dashed line indicates cutoff between false- and true-positive values. False-positive rate = 3% ART-naïve HIV, 0% HIV on NRTI, 6% HIV on cART, and 4% HIV on cART with undetectable VL. (B) Vpr mRNA in liver of Vpr-Tg (n = 5) compared to wild-type (WT) littermates (n = 5) and in PGF of Vpr-Tg (n = 8) compared to WT (n = 5); “+” indicates positive control DNA. (C) Vpr protein in sera of Vpr-Tg and sVpr-treated mice. Horizontal lines indicate mean values. *P = 0.001 for ART-naïve compared to cART-treated HIV patients.

