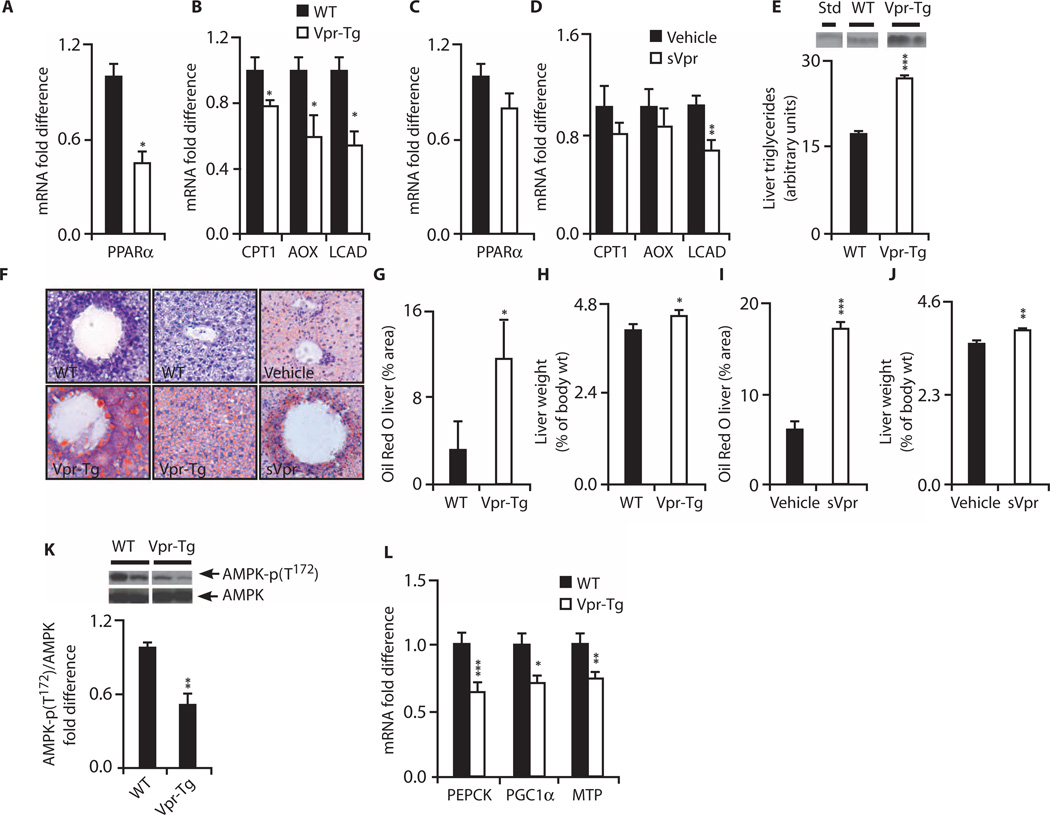
Fig. 7. Hepatosteatosis and altered hepatic expression of PPARα-regulated oxidative genes in Vpr-Tg and sVpr-treated mice.
(A) Reduced Pparα mRNA in Vpr-Tg (n = 8 per group; P = 0.03). (B) Reduced mRNA of Cpt1α (P = 0.05), Aox (P = 0.02), and Lcad (P = 0.03) in Vpr-Tg (n = 8 per group). (C) Pparα mRNA in sVpr-treated compared to water-treated mice (n = 8 per group). (D) mRNA of Lcad (P = 0.009), Cpt1α, and Aox in sVpr-treated mice (n = 8 per group). (E) Increased liver triglyceride content in Vpr-Tg (n = 3 per group, P = 0.0005). (F) Oil Red O–stained liver sections of Vpr-Tg compared to WT mice and sVpr-treated compared to water-treated mice (×40). (G) Increased Oil Red O staining in Vpr-Tg (n = 6) compared to WT (n = 4) liver (P = 0.05). (H) Increased liver mass (normalized to body weight) in Vpr-Tg (n = 4 per group; P = 0.05). (I) Increased Oil Red O staining in liver of sVpr-treated mice (n = 6 per group; P = 0.0001). (J) Increased liver mass (normalized to body weight) in sVpr-treated mice (n = 8 per group; P = 0.004). (K) Reduced ratio of phosphorylated AMPK to total AMPK in Vpr-Tg (n = 5) compared to WT (n = 4) liver (P = 0.01). (L) Decreased Pepck (P = 0.001), Pgc1α (P = 0.04), and Mtp (P = 0.008) mRNA in liver of Vpr-Tgmice (n = 8 per group). Values are means ± SE. *P < 0.05, **P < 0.01, ***P < 0.001.

