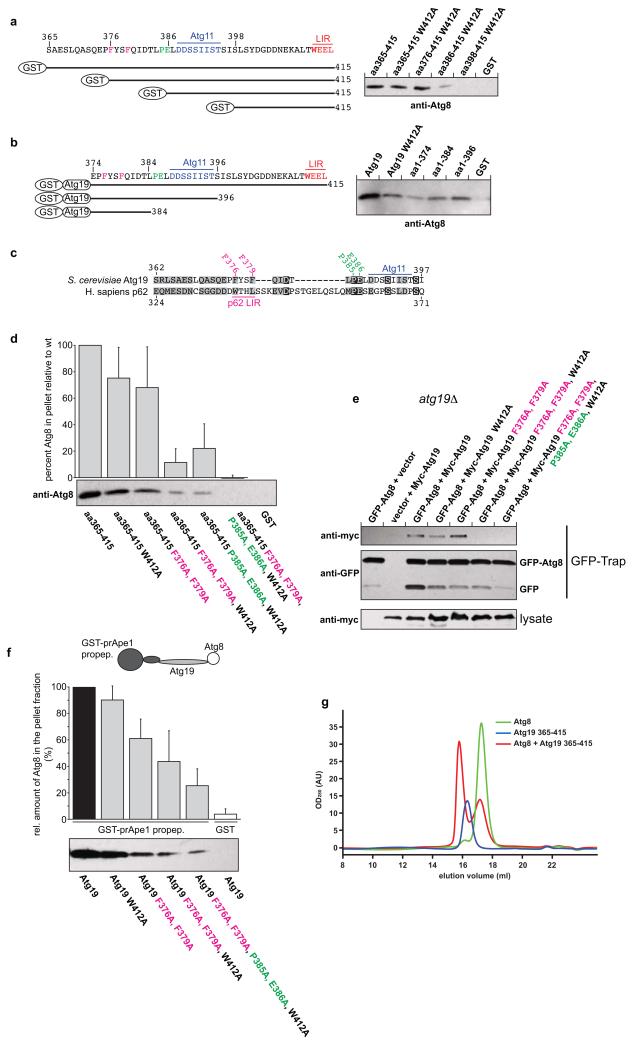
Figure 3.
The C-terminus of Atg19 contains multiple Atg8 binding sites
(a, b) Anti-Atg8 western blots using the indicated GST fusion proteins shown on the left as bait to pull down Atg8. See Supplementary Fig. 1 for input gels. (c) Alignment of the Atg19 C-terminus lacking the LIR motif with the region around the LIR motif of human p62 (NP_003891.1). The amino acids shown in magenta and green indicate the residues mutated in the experiments shown in (d-f). (d) Anti-Atg8 western blots with the indicated GST-fusion proteins as bait to pull down Atg8. Quantification of the amount of Atg8 pulled down by the indicated GST fusion protein. The graph is based on 3 independent experiments (N = 3), one of which is shown below the graph. Shown are the averages and standard deviations. (e) GFP-Trap pull down experiment using yeast cells with integrated GFP-Atg8 transformed with the indicated Myc-Atg19 constructs. (f) Pull down experiment using the GST-prApe1 propeptide to pull down Atg8 via the indicated Atg19 proteins. The graph is based on 3 experiments (N = 3), one of which is shown below the graph. Shown are the averages and s.d. See Supplementary Fig. 2 for input gel. (g) Representative profile of a size exclusion chromatography run using a 10/300 S200 column. Atg8 was run at 400μM and the Atg19 C-terminus at 40μM. For the complex run both proteins were pre-incubated at the concentrations mentioned. The average number of Atg8 molecules shifted into the complex peak per 1 Atg19 C-terminus was 4.14 (average of 3 experiments). The experiments shown in (a, b, d, f, g) have been conducted three times; the experiment shown in (e) has been conducted two times. Images of uncropped western blots and gels can be found in Supplementary Figure 7.

