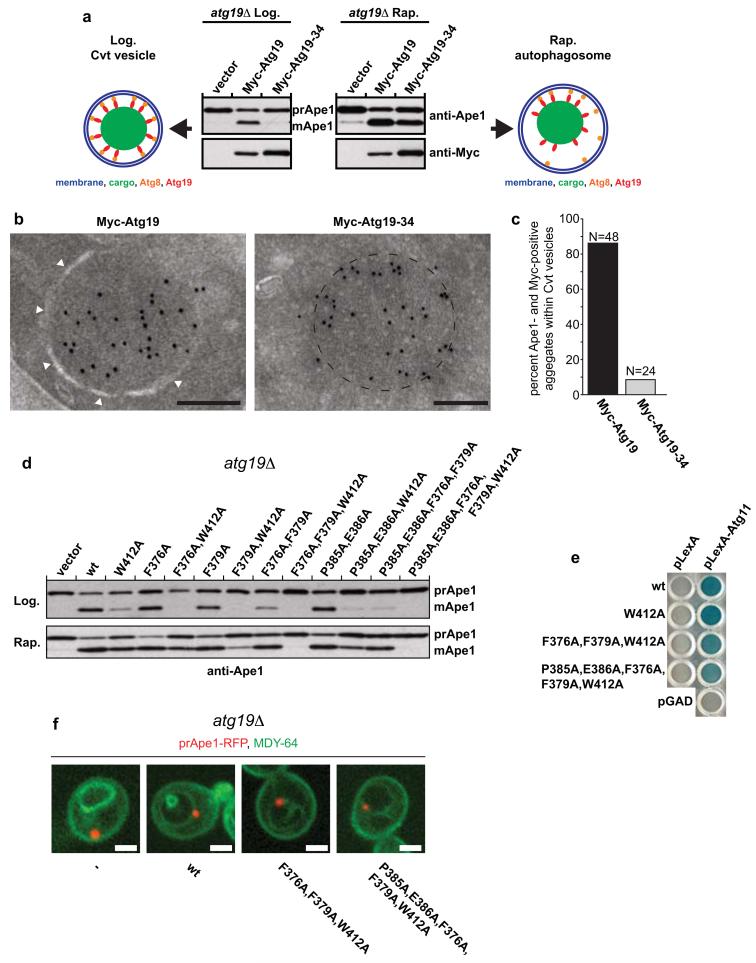
Figure 6.
Requirements for the Atg19-Atg8 interaction for cargo delivery during selective and bulk autophagy.
(a) Anti-Ape1 western blot of atg19Δ cells transformed with the indicated expression constructs. The lower Ape1 band indicates prApe1 processing and thus its delivery into the vacuole. (b) Representative electron micrographs of ypt7Δ, atg19Δ yeast cells grown under Cvt conditions expressing the indicated proteins labelled with an anti-Myc antibody. The white arrowheads indicate the isolation membrane. The dashed line indicates the circumference of the prApe1 oligomer. Gold particles: 10nm. Scale bars: 200nm. See Supplementary Fig. 5 for full images. (c) Quantification of electron micrographs of yeast cells expressing either Myc-Atg19 or Myc-Atg19-Atg34 co-labelled with anti-Myc (10nm gold) and anti-prApe1 (5nm gold). See also Supplementary Fig. 5. (3 independent experiments, Myc-Atg19: N = 48, Myc-Atg19-34: N = 24). (d) Anti-Ape1 western blot of atg19Δ cells transformed with the indicated expression constructs. The lower Ape1 band indicates prApe1 processing and thus its delivery into the vacuole. Supplementary Fig. 6 shows the expression of the Myc-tagged proteins and a quantification of the assay. (e) Yeast-two-hybrid assay testing for the interaction of Atg11 with Atg19 and the indicated Atg19 mutants. (f) Atg19Δ yeast cells expressing the indicated Atg19 proteins and prApe1-RFP were labelled with the vacuolar membrane dye MDY-64. Scale bars: 2μM. The experiments in (a-d, f) have been conducted 3 times; the experiment in (e) two times. Images of uncropped western blots and gels can be found in Supplementary Figure 7.

