
Figure 1.
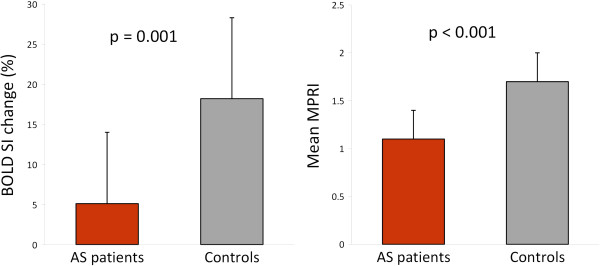
BOLD SI change and MPRI in AS patients when compared to normal controls. Error bars represent standard deviation.
Official websites use .gov
A
.gov website belongs to an official
government organization in the United States.
Secure .gov websites use HTTPS
A lock (
) or https:// means you've safely
connected to the .gov website. Share sensitive
information only on official, secure websites.
BOLD SI change and MPRI in AS patients when compared to normal controls. Error bars represent standard deviation.