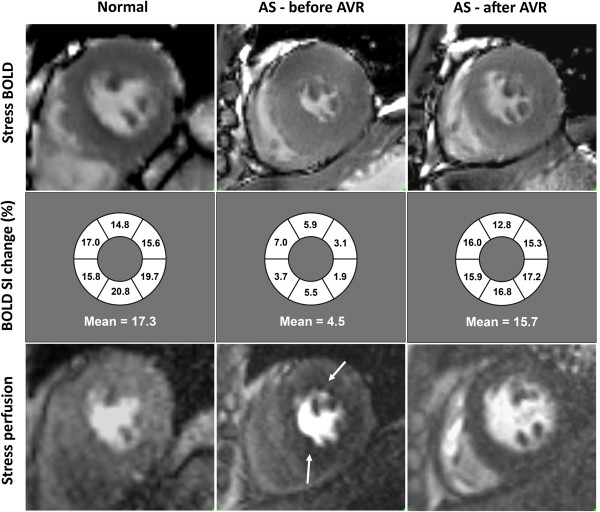
Figure 3.
Examples of BOLD imaging. From top to bottom panels, short-axis stress BOLD, schematic diagram of segmental BOLD SI change, and stress perfusion. From left to right, normal volunteer, a patient with severe aortic stenosis (AS) before and after aortic valve replacement (AVR). Note the circumferential perfusion defect in the AS patient pre AVR (white arrows), which is no longer present after AVR.

