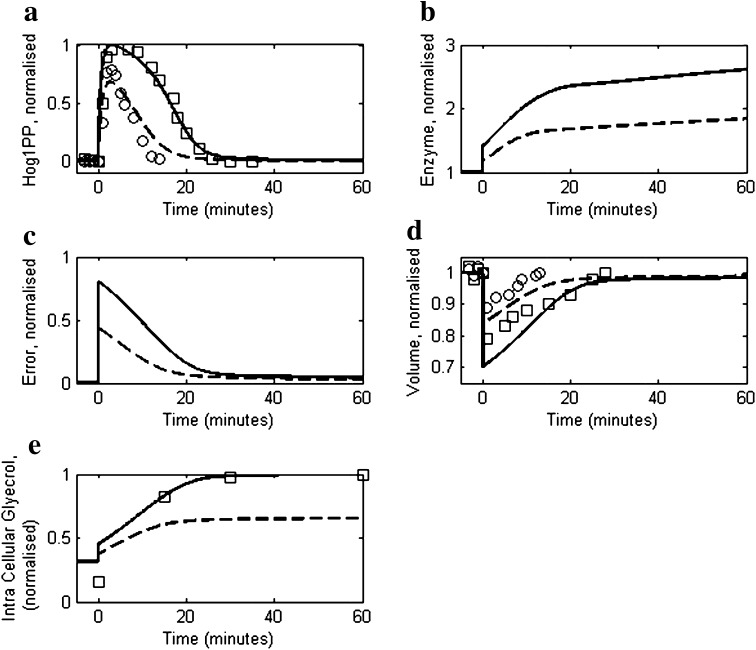
Fig. 3.
Comparison of reduced model simulation with the experimental data for moderate osmotic stress response of yeast cells as reported in Muzzey et al. (2009). Dashed and solid lines represent model simulations for 0.2 and 0.4 M salt concentrations, respectively. Open circles and squares represent experimental data for 0.2 and 0.4 M salt concentrations, respectively. In all the cases the NaCl concentration was increased from 0 M to their corresponding level at t = 0 min. a The profiles of Hog1PP deviations (i.e. deviation from pre-shock level), normalised by the maximum deviation obtained in case of 0.4 M. b The profile of enzyme levels, normalized by the pre-shock level. c Model prediction of error as defined in Eq. 1. d Cell volume profiles, normalised by the pre-shock cell volume. e Intracellular glycerol profile, normalised by the maximum level obtained in 0.4 M NaCl shock

