
Figure 1.
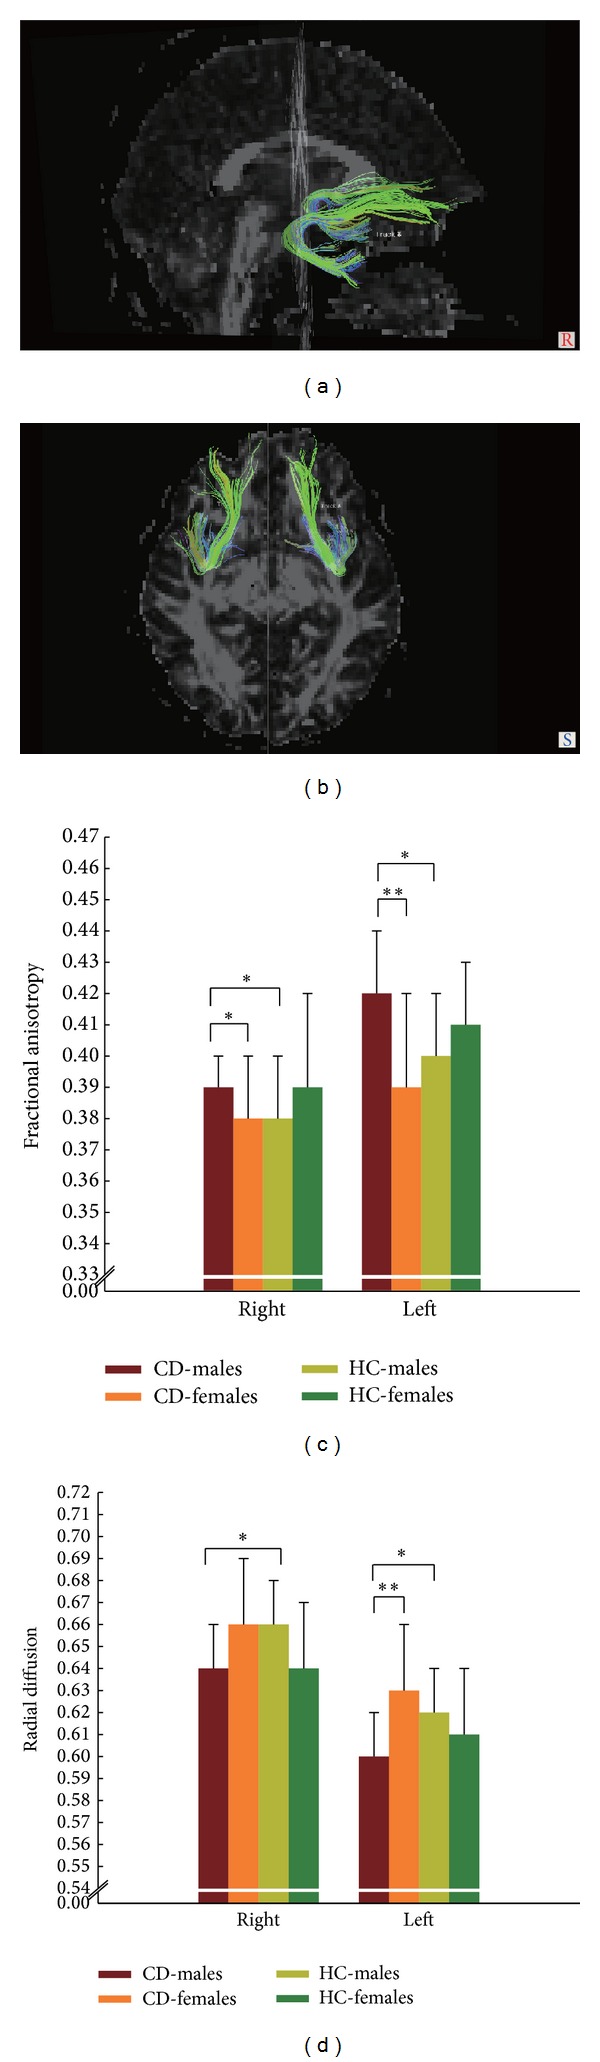
Example of reconstructions of bilateral uncinate fasciculus pathways. (a) Sagittal view and (b) axial view. Comparison of fractional anisotropy (FA) values (c) and radial diffusivity (RD) values (d) in four subgroups. *P < 0.05; **P < 0.01; HC: healthy control.