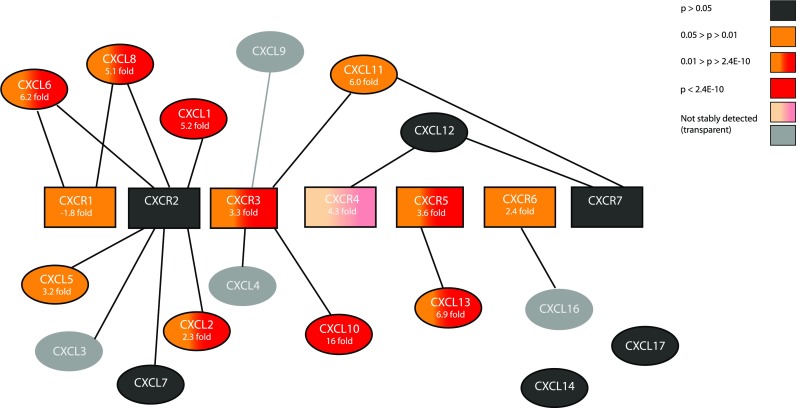
Fig 2.

Summary of microarray expression data for all CXC-chemokine ligands (oval) and receptors (squares), except CXCL15, in tongue tumours compared to normal controls. Colour indicates significance as defined in the figure. P < 2.4E-6 is the Bonferroni corrected significance level recommended when all genes in a 20 818 gene array is tested. Only two genes fall below this level. Fold changes can be found in each shape
