Figure 4.

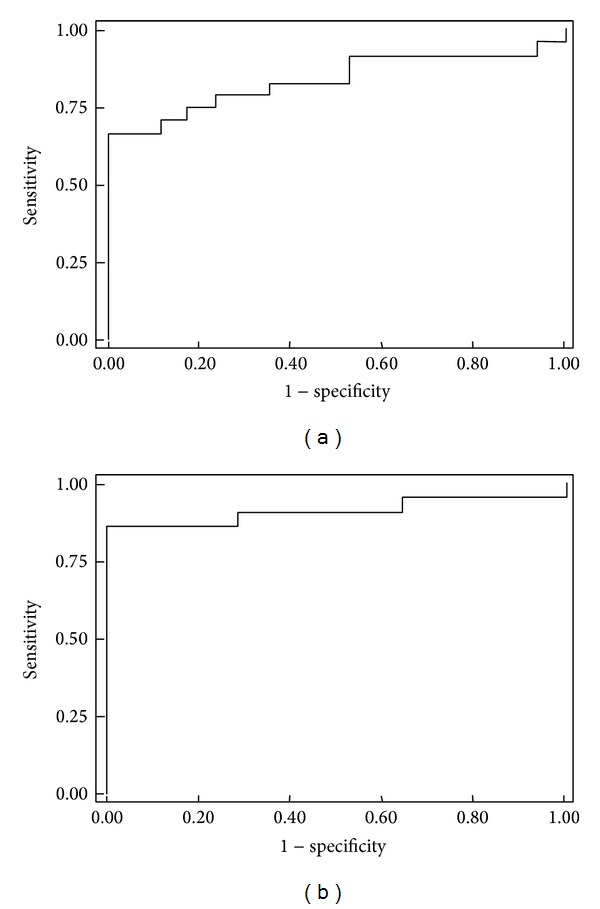
ROC curves for a panel of the three genes RASSF1A, B4GALT1, and SSBP2, individually, (a) and after adjusting a logistic regression model with HCC risk factors: age, gender, ethnicity, and etiology. (b).

ROC curves for a panel of the three genes RASSF1A, B4GALT1, and SSBP2, individually, (a) and after adjusting a logistic regression model with HCC risk factors: age, gender, ethnicity, and etiology. (b).