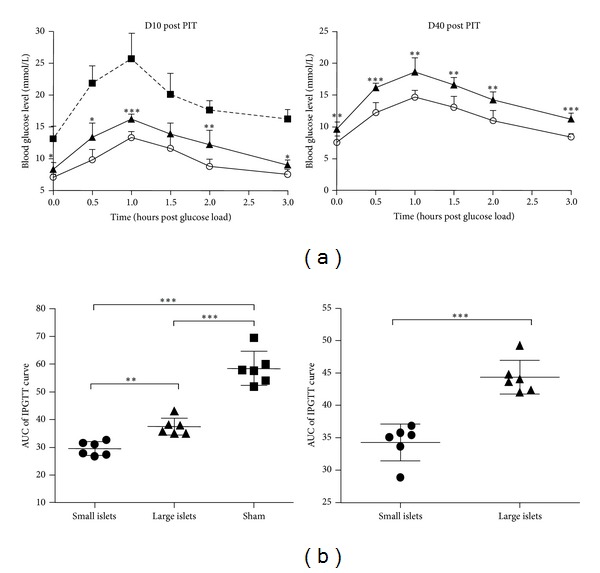
Figure 4.

IPGTT of rat recipients after PIT at indicated time points. (a) IPGTT of rat recipients after PIT at d10 and d40, respectively. At the 10th day after PIT, the glucose levels of indicated time after intraperitoneal glucose challenge were significantly higher in large islets PIT group than in small islets PIT group (P = 0.0335, 0.0106, 0.0002, 0.0507, 0.0078, and 0.0103 for 0 h, 0.5 h, 1 h, 1.5 h, 2 h, and 3 h, resp.). At the 40th day, the small islets recipient group demonstrated a better glucose tolerance (P = 0.0074, 0.0002, 0.0028, 0.002, and 0.0026 and P < 0.0001 at 0 h, 0.5 h, 1 h, 1.5 h, 2 h, and 3 h, resp., during IPGTT). (b) Comparison of AUCs calculated from IPGTT curves above also indicated both better short-term effectivity and longevity of small islets transplantation (for both P < 0.0001).
