
Figure 1.
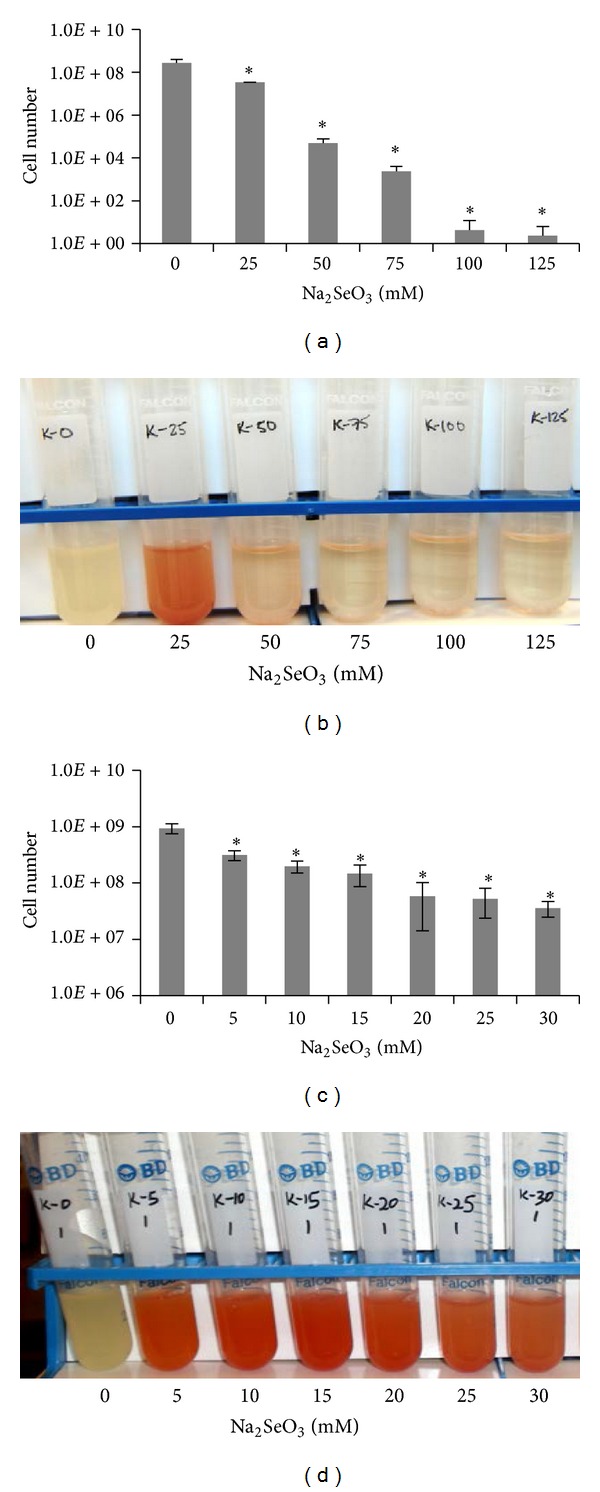
Effect of Na2SeO3 treatment on E. coli cell growth and selenite reduction. The number of bacterial cells under 0 to 125 mM Na2SeO3 treatments (a) and 0 to 30 mM Na2SeO3 treatments (c). The experiment was performed with three biological replicates and each Na2SeO3 treated sample was analyzed in triplicate. Data plotted was the average of cell numbers ± SD. A representative of change in color of cultures treated with 0 to 125 mM Na2SeO3 (b) and 0 to 30 mM Na2SeO3 (d). *P ≤ 0.05.