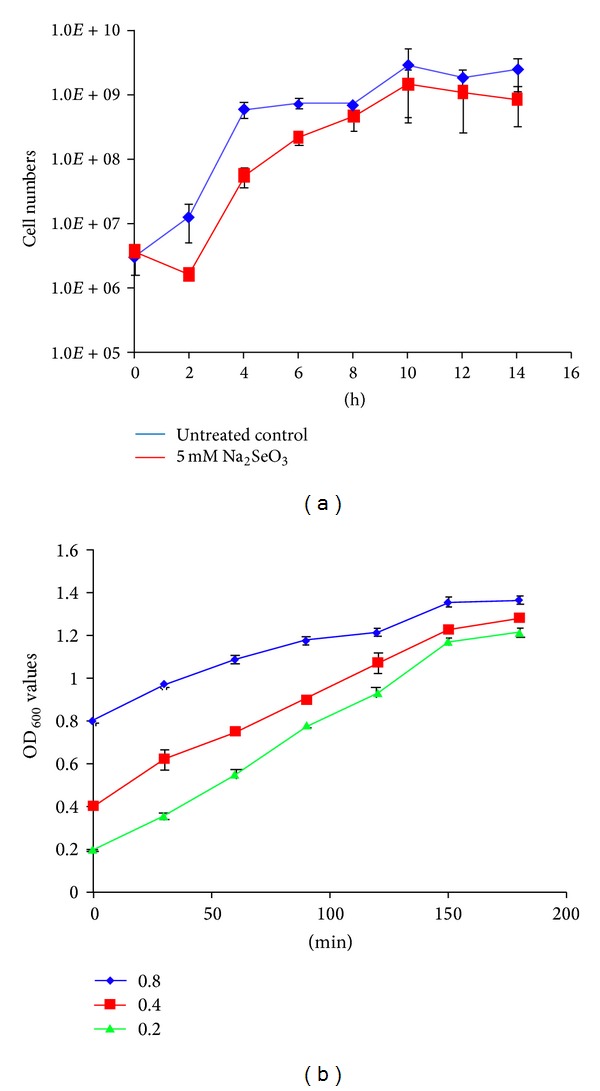
Figure 3.

The growth curve of bacterial cells. The growth curve of cells cultured with or without 5 mM Na2SeO3 (a). The growth curve of cells cultured with initial culture concentrations of OD600 values of 0.2, 0.4, and 0.8 (b). Each experiment was performed with three biological replicates and each treatment was assayed in triplicate. Data plotted was the average ± SD.
