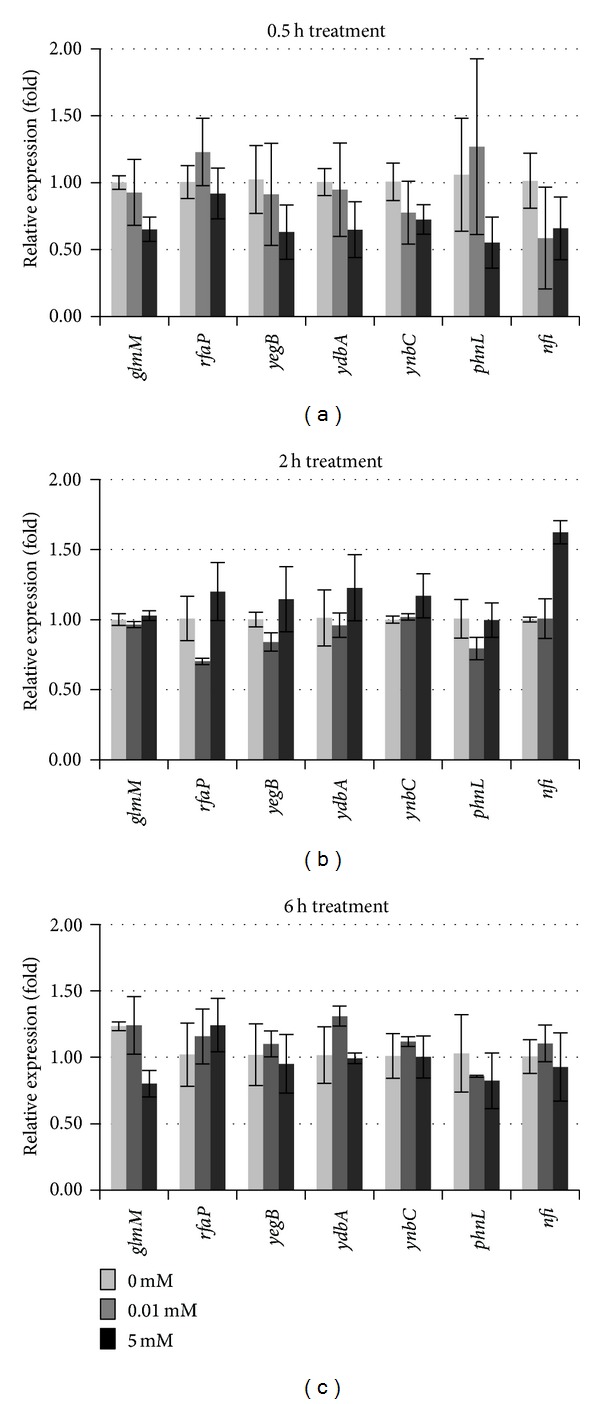
Figure 5.

Transcript levels of seven selenite-responsive candidate genes quantified by qRT-PCR. The RNA samples were isolated from bacteria cells grown under 0, 0.01, or 5 mM Na2SeO3 treatment for (a) 0.5, (b) 2, or (c) 6 h. Data shown are fold changes calculated as transcript levels of selenite treated samples compared to untreated (defined as 1). Data represent an average of three biological replicates ± SD. Each replicate was assayed in triplicate.
