Figure 1.

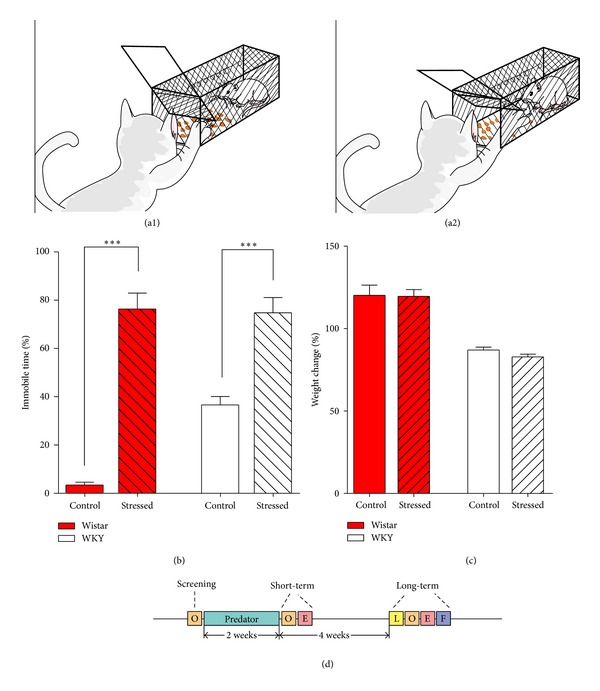
(a1) and (a2) procedure of predator stress. The feral cat could open the door to get the food inside, which intensely stressed the rat inside. The cage and the door were not large enough to allow the cat to fully enter, avoiding actual contact between the cat and the rat. Stimulations lasted for 10 min every day for 2 weeks. (b) Changes in the percent of freezing time of rats when exposed to predator stress. The percent of freezing time increased significantly while being exposed to a predator in both strains. Note that the control group of Wistar and WKY rats also showed differences in the percentage of freezing time. (c) Weight changes of rats before and after 2-week predator stress. Statistical differences only existed between the strains, not within the strains. Each bar indicates a group defined according to strains (Wistar rats and WKY rats) and predator exposure (red bar: Wistar rats; white bar: WKY rats; unshadowed bar: control group; shadowed bar: predator exposure). Values are shown as mean ± SEM. The results of t-test are shown. ***P < 0.001 for the effects of predator stress. (d) Procedure of experiment. O: open field test; E: elevated plus maze test; L: light/dark transition test; F: forced swim test; Predator: predator stress.
