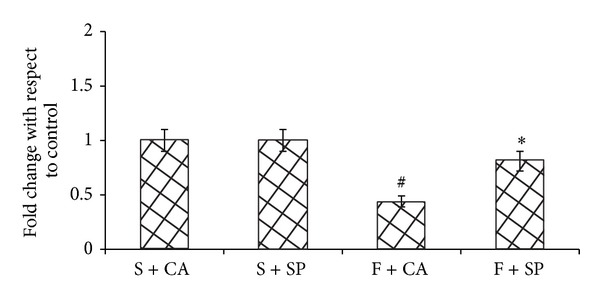
Figure 4.

Adiponectin expression. F + SP group showed improved adiponectin expression whereas F + CA decreased the adiponectin expression when compared to the starch fed counterpart. Values are means ± SD (n = 4). Bars with different symbols denote significance (P < 0.05) with respect to the starch fed counterparts.
