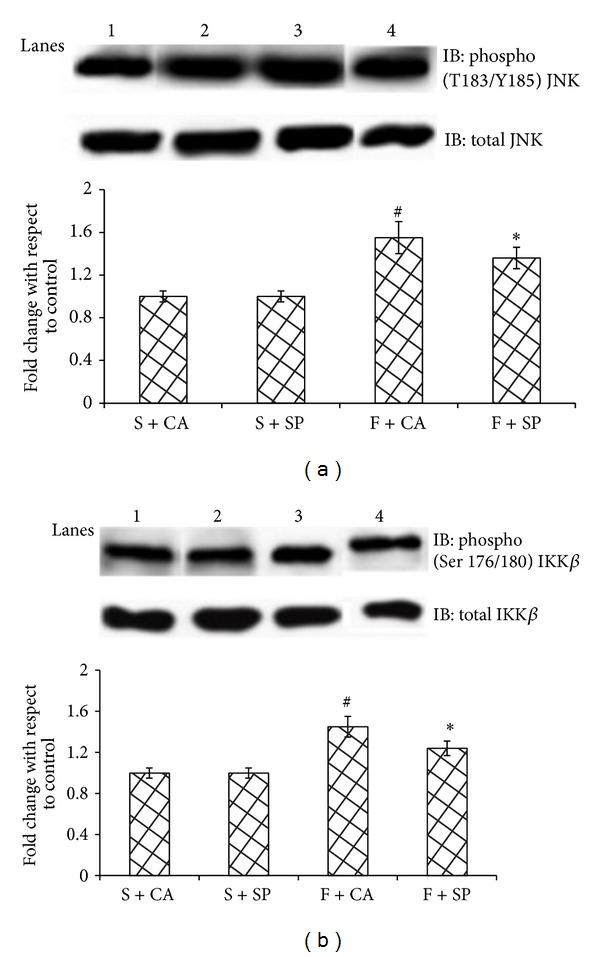
Figure 5.

Immunoblots and representative graphs of JNK and IKKβ. Lane 1: S + CA, Lane 2: S + SP, Lane 3: F + CA, and Lane 4: F + SP. F + CA group shows increased phosphorylation of (a) JNK and (b) IKKβ compared to the starch fed counterparts. Soy protein substitution for casein (F + SP group) reduced the protein abundance of inflammatory kinases. Values are means ± SD (n = 4). Bars with different symbols denote significance (P < 0.05) with respect to the starch fed counterparts.
