Figure 2.

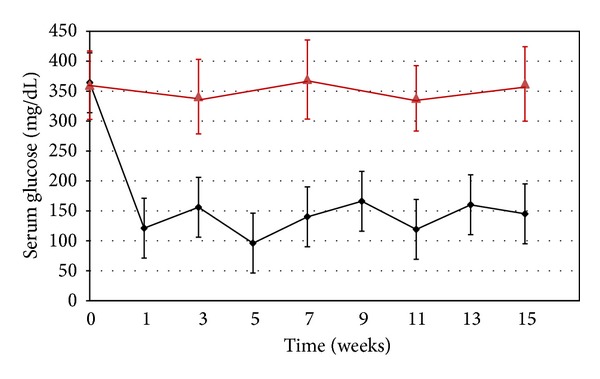
Chart showing mean ± SD for serum glucose levels for the apoE−/− diabetic mice treated with insulin from time 0 (after 6 weeks of diabetes) through week 16 (black line) and untreated control mice (red line).

Chart showing mean ± SD for serum glucose levels for the apoE−/− diabetic mice treated with insulin from time 0 (after 6 weeks of diabetes) through week 16 (black line) and untreated control mice (red line).