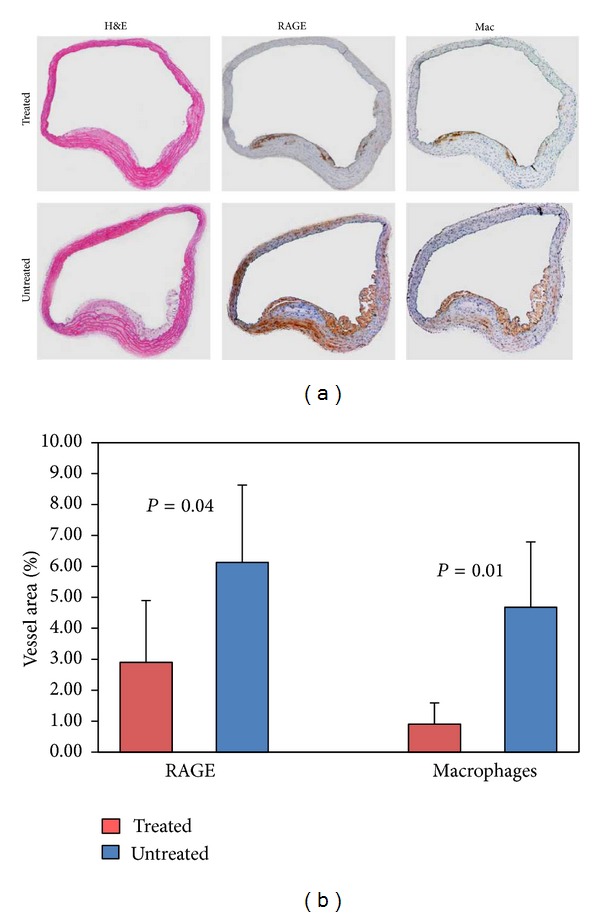
Figure 5.

Cross-sections of aortic tissue stained for H&E (left), RAGE (middle), and macrophages (right) for treated mouse (top row) and untreated mouse (bottom row). The untreated mouse shows a larger lesion size and greater staining for both RAGE and macrophages. Graph depicts results of quantitative histomorphometry showing significantly lower area of cells staining + for both RAGE and macrophages in the treated group.
