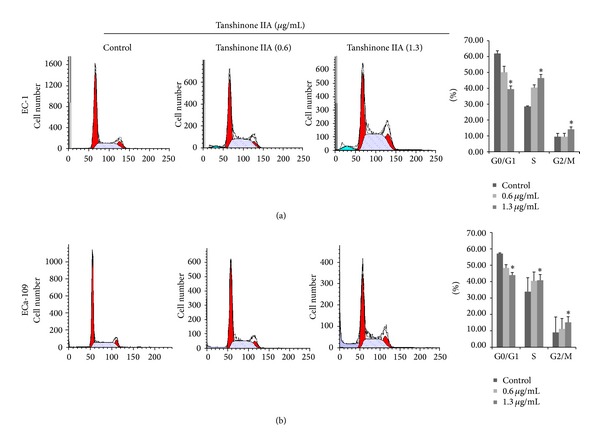
Figure 5.

Cell cycle analysis of esophageal cancer cells treated with TanIIA. (a) EC-1 cell; (b) ECa-109 cell. Cells were treated with concentrations of 0.6 and 1.3 μg/mL TanIIA for 48 h, respectively. Both the control and treated cells were harvested and subjected to flow cytometric analysis. After TanIIA treatment, cells in S and G2/M phase increased, and the cells in G0/G1 phase decreased. Data represent means ± SD. *P < 0.05 versus control.
