Figure 1.

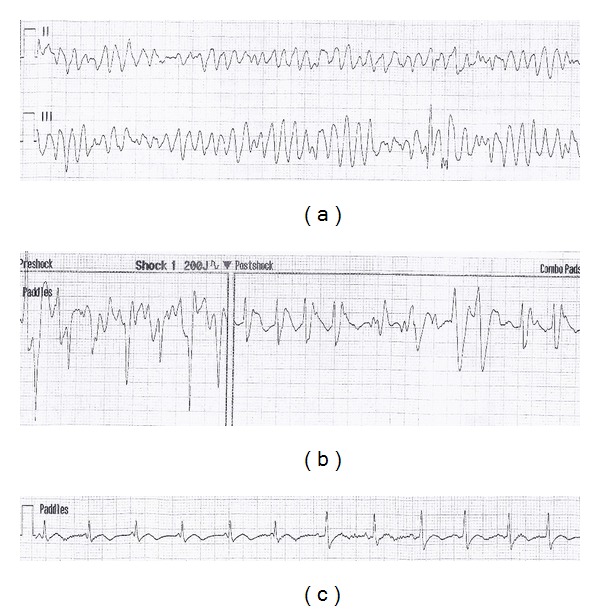
AED rhythm strip demonstrating: (a) TdP in Leads II and III, (b) resolution of TdP following defibrillation at 200 J, and (c) normal sinus rhythm in Lead II after defibrillation.

AED rhythm strip demonstrating: (a) TdP in Leads II and III, (b) resolution of TdP following defibrillation at 200 J, and (c) normal sinus rhythm in Lead II after defibrillation.