
Figure 3.
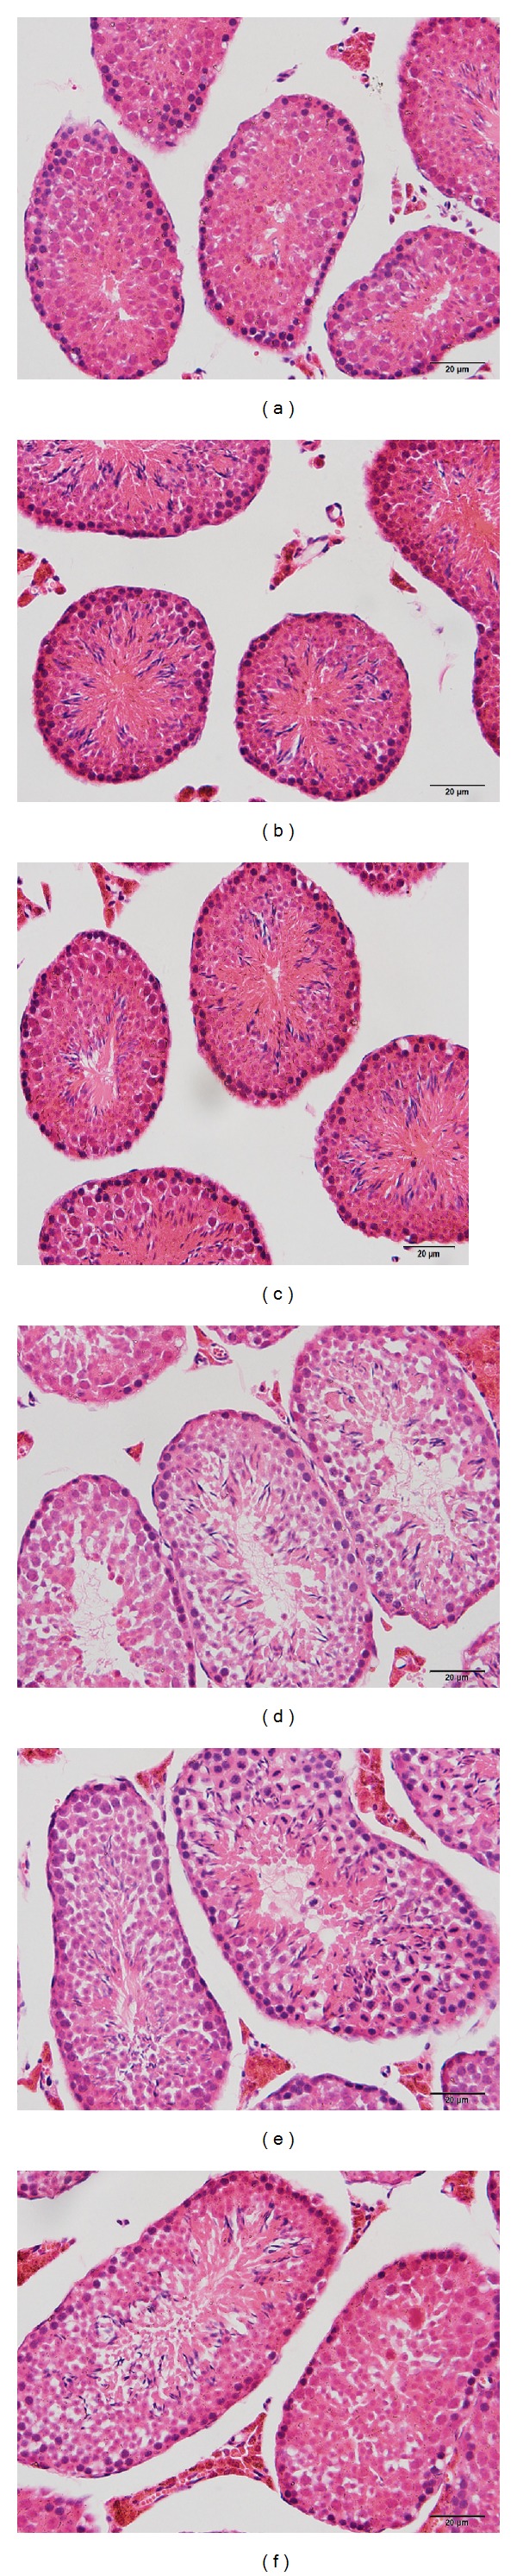
Light microphotographs showed the morphological changes of testicular cells after 8 and 19 weeks of high-fat diet. Photographs of control at 8 weeks (a), DIO group at 8 weeks (b), DIO-R group at 8 weeks (c), control group at 19 weeks (d), DIO group at 19 weeks (e), and DIO-R group (f) at 19 weeks were in this figure. The sections were stained with HE staining. Magnification ×40.