
Figure 1.

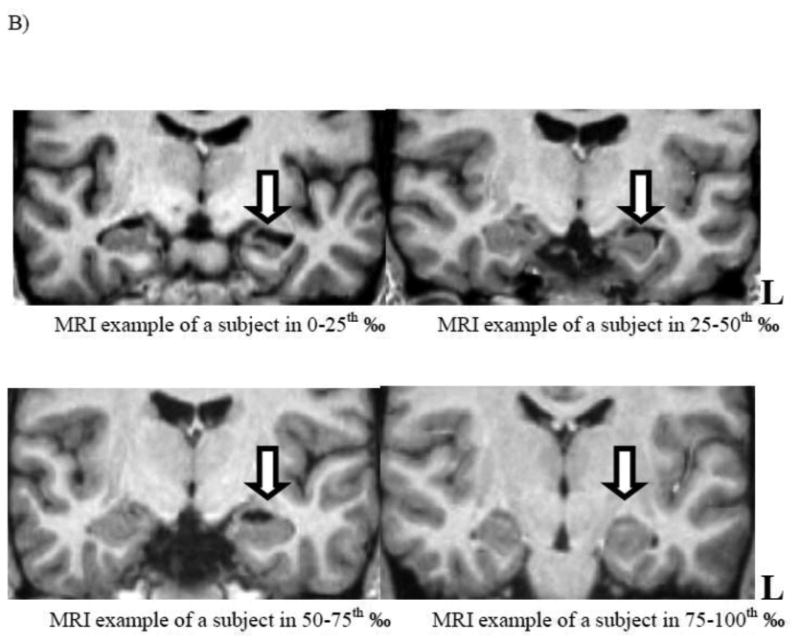
A) Boxplots with median lines and extremes for each quartile (n= 7) of the left hippocampal volume, in mm3, are compared with the total BDI score. B) Coronal sections of the representative MRI T1-weighted images show temporal structures and hippocampi for each quartile: the upper left and right, and lower left and right images show the left hippocampi in the lowest quartile (note the “ribbon” sign), second, third and the fourth quartile, respectively.