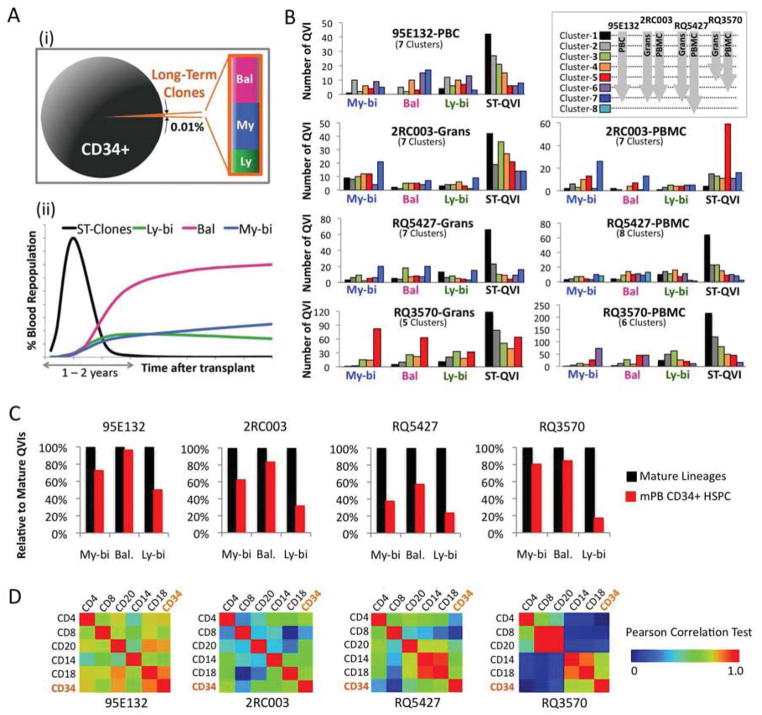
Figure 5. Summary Diagrams Showing the Relative Proportions of HSPC Subpopulations and Their Contributions to Blood Repopulation Over Time.
(A) Summary Diagrams. Figure (i) shows the relative proportions of long-term repopulating cells within the transplanted CD34+ cell pool. Figure (ii) shows the contributions of short-term clones (ST-Clones) and the three subtypes of long-term clones over time. (B) These charts show variable repopulation kinetics among the clones within each subpopulation. The numbers of My-bi, Bal, Ly-bi, and ST-QVI clones in the various kinetics clusters are indicated by bar graphs. The clusters and color codes for each cluster are the same as those in Fig. 3A. (C) The bar graphs show the proportions of My-bi, Bal, and Ly-bi clones present in the CD34+ HSPC pool near the endpoint (denoted by red bars) relative to the total detected in the mature lineages (denoted by black bars) (see Fig. 4A–D(i) for individual clones in mature lineages and CD34+ cells). The long-term HSPC population is relatively enriched for the Bal and the My-bi clones. (D) Comparison of clonal compositions across cell types. The relative frequencies of individual clones are compared between cell types. The Pearson correlations coefficient value (r) is indicated by a rainbow color scheme.

