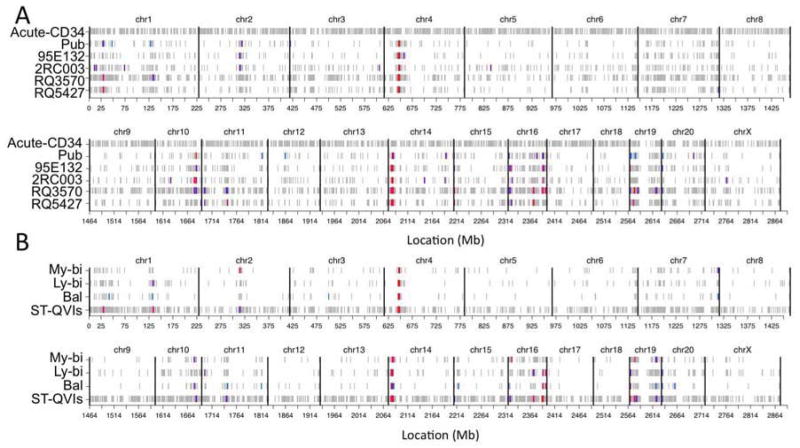
Figure 6. Vector Integration Site Bias Conserved Across Animals and Functional Subgroups.
(A–B) Genomic VIS hot-spots in four test animals are shown in (A) in comparison with those of published (pub) and freshly infected naïve CD34+ cells (acute). Hot-spots in My-bi, Ly-bi, Bal, and ST-QVIs (four animals combined) are shown in (B). Each row shows the complete VIS pattern for one data set, where data set names are indicated on the y-axis, and the x-axis gives the genomic location of the VIS in Mb units. Vertical black bars indicate chromosomal boundaries. Color definitions were assigned for each data set independently, based on relative VIS density. Hot-spot regions are colored in red. One of the strongest hot-spots was located at chromosome (chr) 4 (29.94–34.01 Mb) hosting about 4.22% of the total VIS with a density of about 69 VIS per Mb. The second major hot-spot was defined as a 4.99 Mb region at rhesus chr14 (5.98–10.97 Mb) containing 5.54% of VIS at a density of 73 VIS/Mb. Hot-spots among subtypes were significantly correlated, with overlap ranging between 29–79% among subtypes and overlap p-values (based on a Fisher’s exact test for hot-bin overlap) ranging from 1.7×10⁻⁷ to 3.3×10⁻²². See Table S3 and Fig. S7 for more details.

