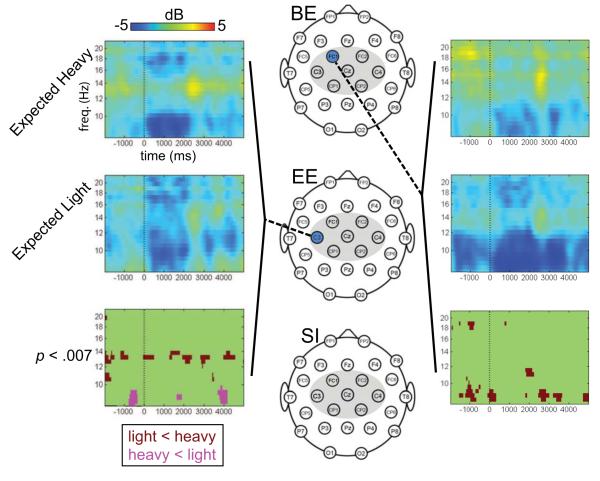
Figure 3. Differences in alpha and beta suppression between heavy and light objects during Part 2 of the experiment, for each group.
The three scalp maps depict the electrode montage (central ROI highlighted with gray). For each group (Brief Experience, BE; Extended Experience, EE; and Semantic Information, SI), the highlighted electrodes (blue) indicate electrodes at which there were significant differences between conditions (p < .007, FDR) at any time or frequency within the analysis epoch. The epoch spanned from −2000 to +5000 ms (time 0 = start of grasping phase), and frequencies from 8-22 Hz were analyzed. Time-frequency plots and statistical maps are shown for selected electrodes of interest. On these plots, averaged ERSPs from observation of heavy and light trials are shown, as are the significant differences between the conditions. Cool colors indicate a decrease in power relative to baseline; warm colors indicate an increase in power. On the statistical map, dark red indicates that power was lower during observation of light trials compared to heavy trials; pink indicates that power was lower during observation of heavy trials than compared to light trials.

