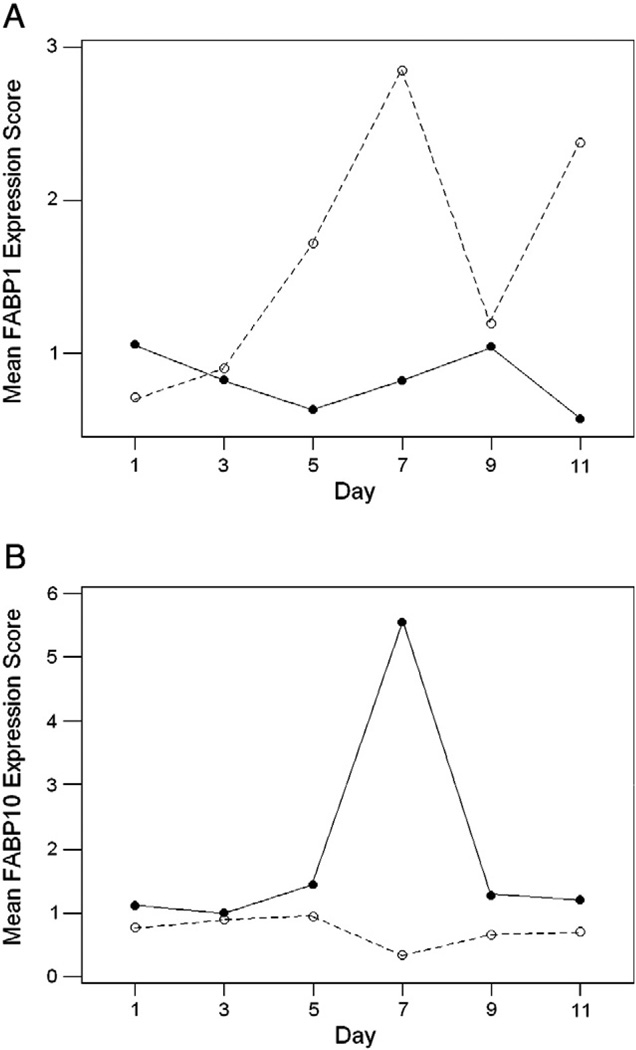
Fig. 3.
Mean expression scores of (A) FABP1 and (B) FABP2 days 1–11 post-hatching in chicken lines selected for high growth (solid lines) and low growth (dotted lines). There were significant line-by-day interactions in both FABP1 expression (F5,36=8.40; P<0.001) and FABP10 expression (F5,36=11.09; P<0.001).

