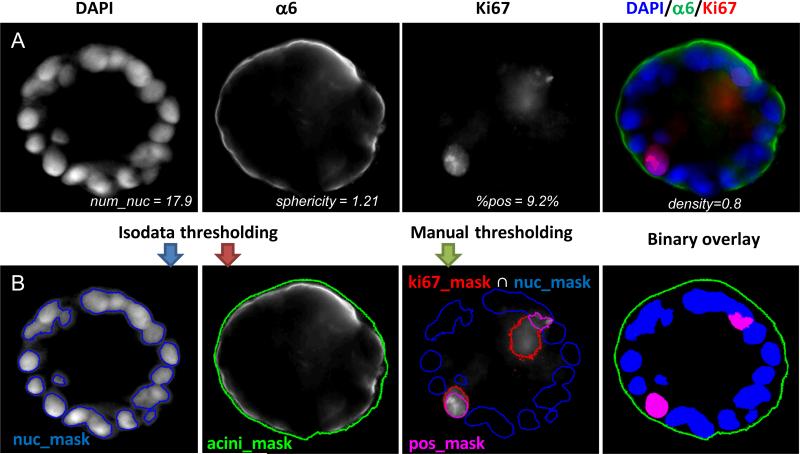
Fig. 1. Quantification of acini properties.
(A) Center slice of a 12 day MCF10A acinus grown on top of Matrigel™ is shown: DAPI for nuclear staining (blue), α6 for basement membrane staining (green) and Ki67 for proliferation marks (red). Merged image is also shown as a color image in the right panel. Values for various imaging properties are displayed for this acinus. (B) Illustration of image analysis. An overlay of the masks for the nuclei (blue mask), for the basement membrane (green contour), and for the proliferating nuclei (purple mask) are shown below each corresponding channel. An overlay of all three binary masks with their corresponding colors is shown in the right panel.

