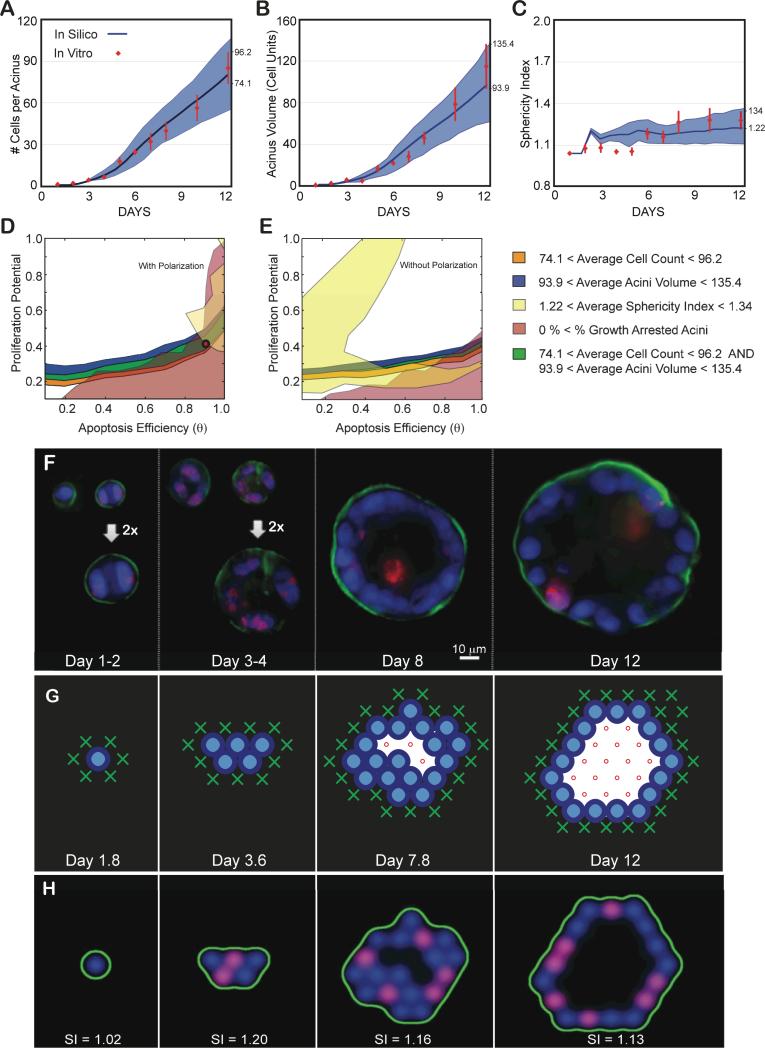
Fig 5. Achieving a normal phenotype in silico and in vitro validation.
(A-C) Experimental data as a function of days in culture. Average and standard deviations from ~100 to 200 acini per time point are shown as red diamonds. (A) Average number of cells contained in one acinus. (B) Average acinar volume (in cell unit). (C) Average acinar sphericity. (D-E) Transition maps are used to identify the parameter space that matches in vitro measurements at day 12. The average ± standard deviation of the measurements set the boundaries for each map. Overlap between the different areas delimits the parameter space matching all considered measurements. Cell number, Acini volume, Acini Sphericity and Growth arrest levels are used to delimit this space. (D) Resulting overlap with Polarization enabled maps from Fig. 3. It leads to a possible region of overlap. The red circle indicates the chosen parameter values (θ = 0.9, Pp = 0.4) within this area. The corresponding predicted in silico measurements for these parameters are displayed in panels A-C as solid blue curves with standard deviations shown as blue shadows. Note for all simulations: agent doubling time was set to 0.6 days with a 1.2 day delay for cells to reenter cycle. (E) Resulting overlap with Polarization disabled maps from Fig. 4. These maps lead to no overlap and therefore no possible fit of the experimental data. (F) Representative center slices of normal acini during the first 12 days in culture (nuclear stain with DAPI in blue, proliferation marks with Ki67 in red, basement membrane with α6 in green). (G) Example of 2D cross-sectional view of an in silico acinus with a normal phenotype obtained with parameters θ = 0.9, Pp = 0.4, and Polarization enabled. (H) 2D cross-sectional view of the same in silico acinus after transforming epithelial and basement membrane agents coordinates into pseudo microscope 3D image. Pseudo images are used to compute acini sphericity index (SI) for each simulation (displayed below each acinus). Red marks proliferating agents, green marks basement membrane agents and blue marks all epithelial agents.

