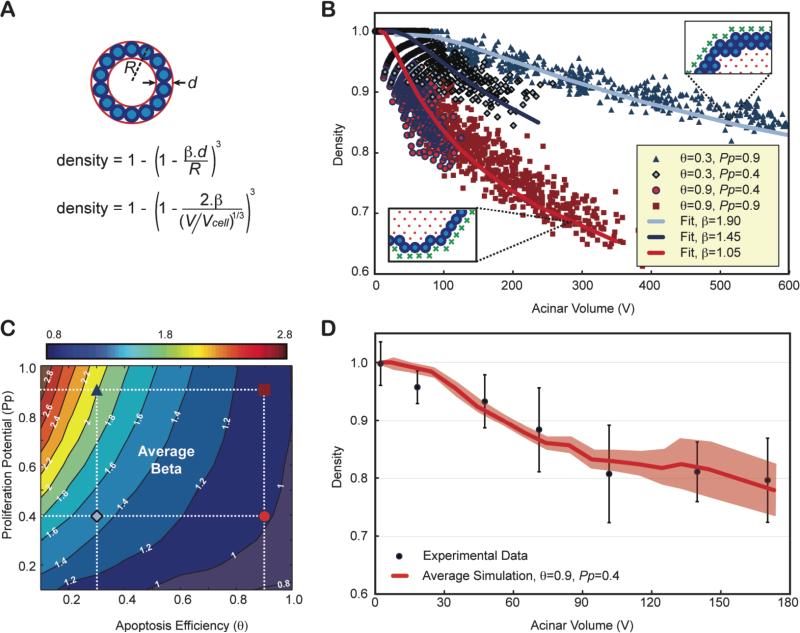
Fig. 6. Contrary to density, epithelium thickness β is an invariant property of an acinus and can be used as an indicator of lumen formation.
(A) Density alone is a poor indicator of normal lumen formation, as it does not only depend on the number of epithelial layers alone (β) but also on the volume of the acinus. One can compute the theoretical density of a spherical acinus of radius R and agents of diameters d with β epithelial layers, as a function of the acinar volume (V) normalized to the cellular occupation (Vcell). (B) Four distinct simulations with different apoptotic efficiencies q and proliferation potential Pp, lead to very distinct lumen formation. Even though simulated acini are not perfectly spherical, simulated densities versus acinar volume can be fitted very accurately. (C) The dependency of density variation versus acinar volume for simulations with θ = 0.9 and Pp=0.4 match experimental data. Experimental densities are averaged over 7 different acini volume bins, mixing all densities from day 1 to day 12, as it was done for simulations. (D) β transition maps. The location of the four parameters conditions whose β values were fitted in panel (B) are marked with the same symbols and colors on the map. The normal phenotype simulated in Fig. 5 is shown as a red circle.

