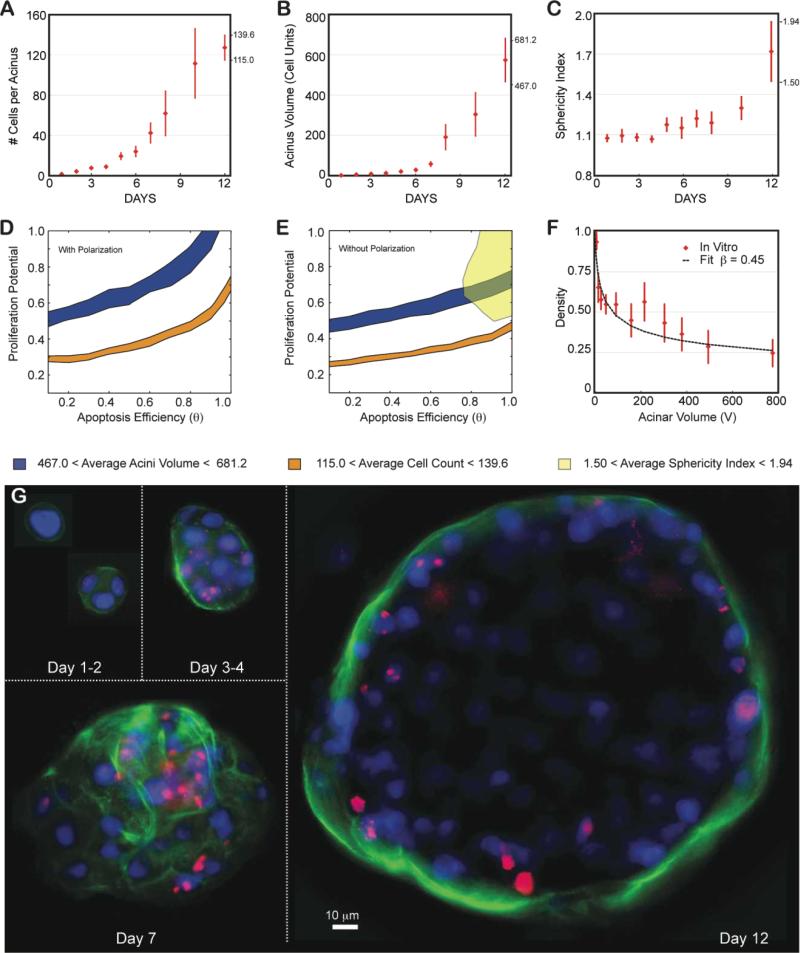
Fig 7. Locating ductal carcinoma in situ using the transition map.
The MCF10A-pER Akt, which have a compromised apoptotic pathways where grown on top of Matrigel™ and quantified similarly to normal MCF10A. (A-C) Experimental data as a function of days in culture. Average and standard deviations from ~100 to 200 acini per time point are shown as red diamonds. (A) Average number of cells contained in one acinus. (B) Average acinar volume (in cell unit). (C) Average acinar sphericity. (D) Satisfying all three measurements at day 12 is impossible with Polarization enabled, as there are no overlapping regions for the different maps. (E) When disabling polarization, there are still no overlapping regions, indicating some additional mechanism is involved. (F) Akt-on acini density decreases much faster with acinar volume compared to normal MCF10A, leading to fit for β of 0.45. (G) Representative center slices of Akt-on acini during the first 12 days in culture (nuclear stain with DAPI in blue, proliferation marks with Ki67 in red, basement membrane with α6 in green).

