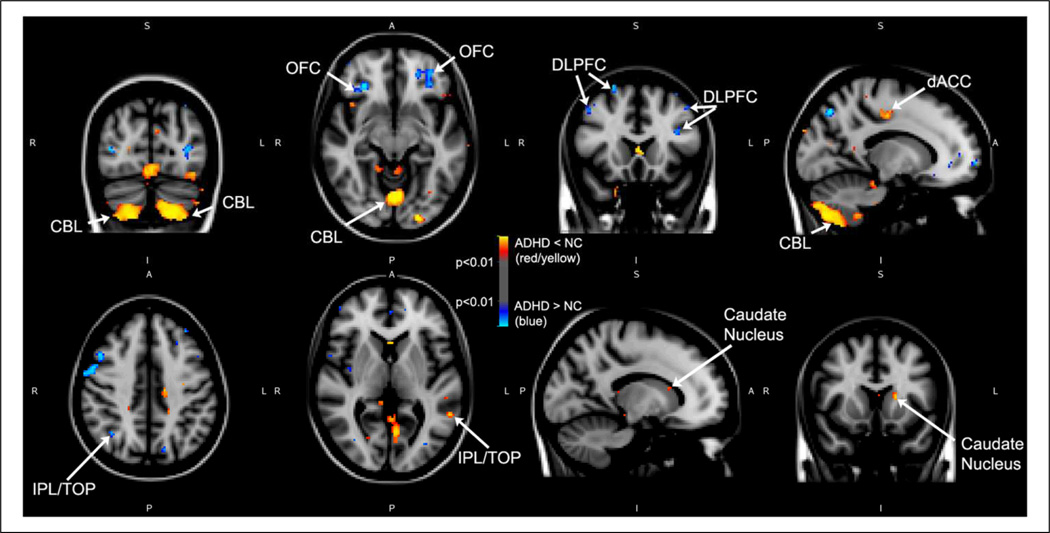
Figure 1.
Voxel-based morphometric differences between medication-naïve adults with ADHD and controls using FSL.
Note: Areas in blue represent larger volumes in medication-naïve participants with ADHD as compared with controls. Instead, red and yellow represent smaller volumes in medication-naïve participants with ADHD as compared with controls. p values are thresholded at p < .01 as shown on the color bar in the middle of the figure.
A = anterior; dACC = dorsal anterior cingulate cortex; CBL = cerebellum; DLPFC = dorsolateral prefrontal cortex; I = inferior; IPL/TOP = inferior parietal lobule/Temporo-occipito-parietal region; L = left; OFC = orbitofrontal cortex; NC = normal controls; P = posterior; R = right; S = superior.

