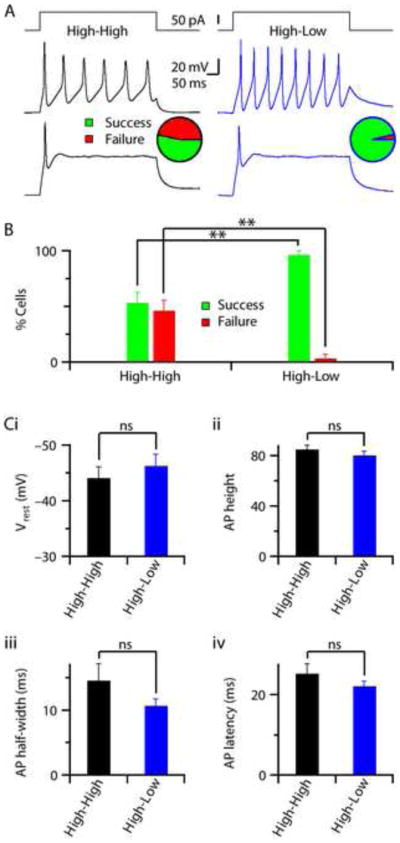
Figure 3. iN cells reprogrammed in low and high oxygen are functionally equivalent.

(A) Cells patched under current-clamp mode and ability of firing AP was determined by a 100 pA current pulse (top panels). Example traces showing the presence of multiple (middle panels) or single (bottom panels) AP-firing cells, both in High-High (black, left) or High-Low (blue, right) conditions. Pie-charts indicate the relative fraction of cells that were able to generate AP (Success, green) or the cells that did not (Failure, red), calculated from the total population of cells patched from four independent experimental batches each with a different HPF line (n = 28 cells / condition). (B) Bar-graphs represent average percentages of iN cells capable of firing AP (Success, green) or failed to do so (Failure, red), calculated from independent experimental batches from different HPF lines presented in Fig.3 A. The High-Low condition showed significantly (n = 4, P < 0.005) higher percentages of cells capable of firing AP and a lower failure rate, when compared to High-High condition. (C) Average bar-graphs demonstrate average values of the intrinsic properties measured from iN cells those are capable of firing AP in High-High (n = 15 cells / 4 batches) and High-Low (n = 27 cells / 4 batches) conditions. No significant differences found in resting membrane-potential (Vrest, P > 0.4) (i), AP height (P > 0.3) (ii), AP half-width (P > 0.1) (iii), and AP latency (P > 0.1), calculated as the time from pulse-start to peak amplitude of AP (iv).
