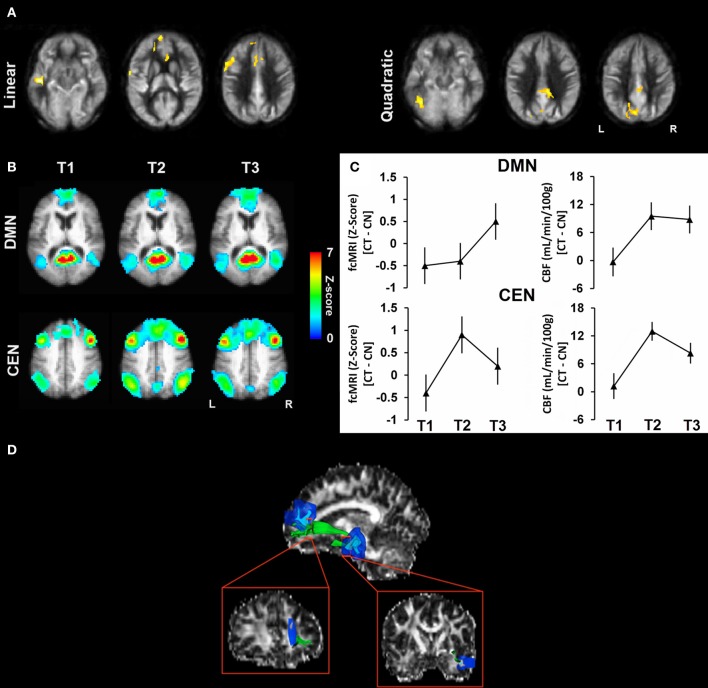
Figure 1.
This figure illustrates the convergence of neural plasticity findings in the cognitive training vs. control group across cerebral blood flow, functional connectivity, and structural DTI changes implicating functional brain changes more frequent and rapid than structural plasticity comparing changes at T2 and T3 to baseline T1 measures. (A) Results of CBF voxel-based comparison superimposed on an average CBF map of all participants for linear and quadratic interaction contrasts. (B) The average functional connectivity maps (i.e., DMN and CEN) of the cognitive training group are overlaid on their average T1-weighted image. (C) Mean increase in fcMRI z-scores (left column) and mean change in absolute CBF (right column) are shown for DMN and CEN across time periods. (D) A representative participant's uncinate fasciculus (green) is overlaid on his fractional anisotropy map from DTI (Chapman et al., 2013).

