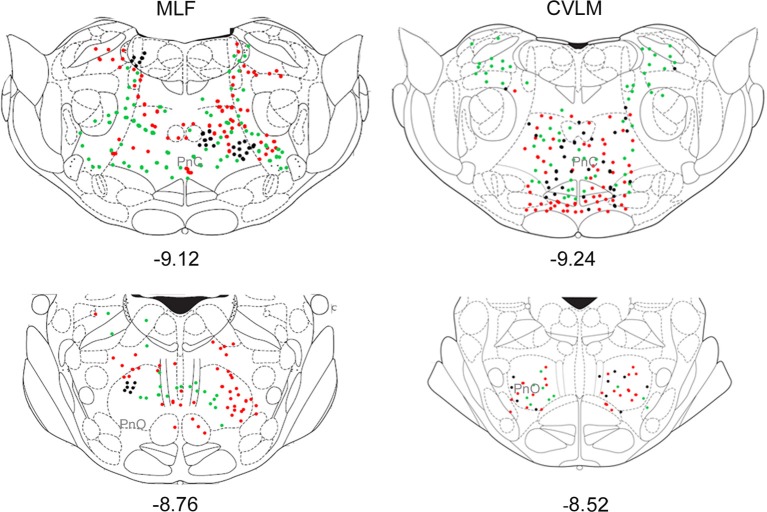
Figure 5.
Distribution of cells in pons. Outline diagrams of coronal sections through the pons at two levels (anterior-posterior coordinates according to Bregma) showing the locations of cells following spinal injections in the right intermediate gray matter and injections within the MLF or right CVLM. Black circles represent double-labeled cells; green circles represent spinally-projecting cells; and red circles represent cells labeled from MLF or CVLM. PnC, pontine reticular nucleus, caudal part; PnO, pontine reticular nucleus, oral part.

