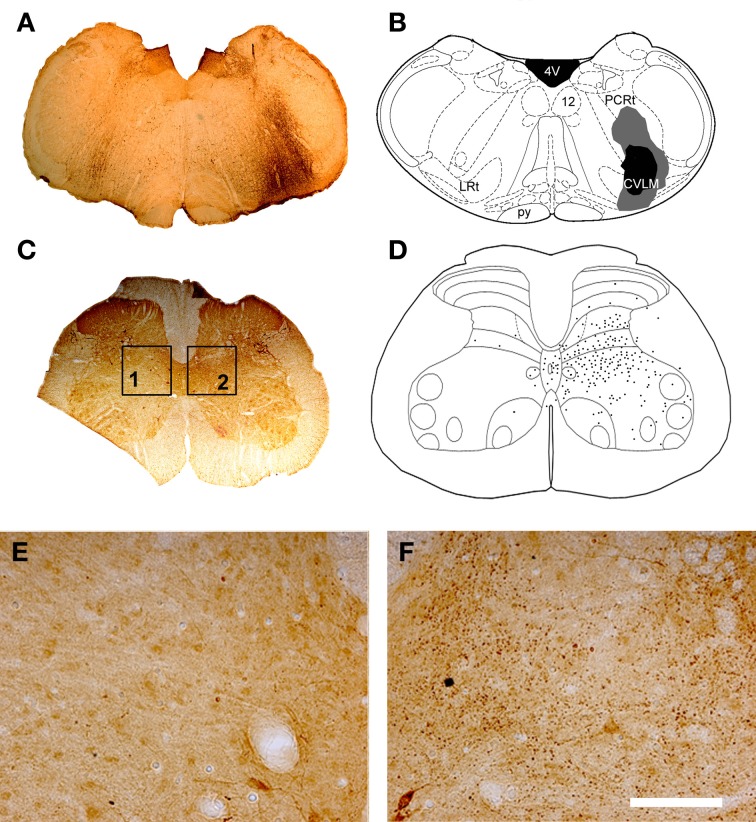
Figure 7.
CVLM injections and distribution of terminals in lumbar spinal cord. (A) Shows a light micrograph of a transverse section through the medulla illustrating a CTb injection site. Injection sites were mapped onto outline diagrams of the medulla (B) obtained from the stereotaxic atlas of Paxinos and Watson (2005). The black area is the core of the injection and the gray area represents the spread of CTb. Plate (C) shows a transverse section through L4 that was reacted to reveal CTb-labeled terminals. (D) The distribution of terminals was mapped onto outline diagrams of the spinal cord. Note the predominance of terminals ipsilateral to the injection site which are concentrated in the intermediate gray matter. (E,F) Are magnified views of boxes 1 and 2 of plate (C). Note the scarcity of terminals contralateral to the injection site (E) and the abundance of terminals on the ipsilateral side (F). Scale bar E and F = 100 μm. 4V, 4th ventricle; 12, hypoglossal nucleus; CVLM, caudal ventrolateral medulla; LRt, lateral reticular nucleus; PCRt, parvicellular reticular nucleus; py, pyramid.

