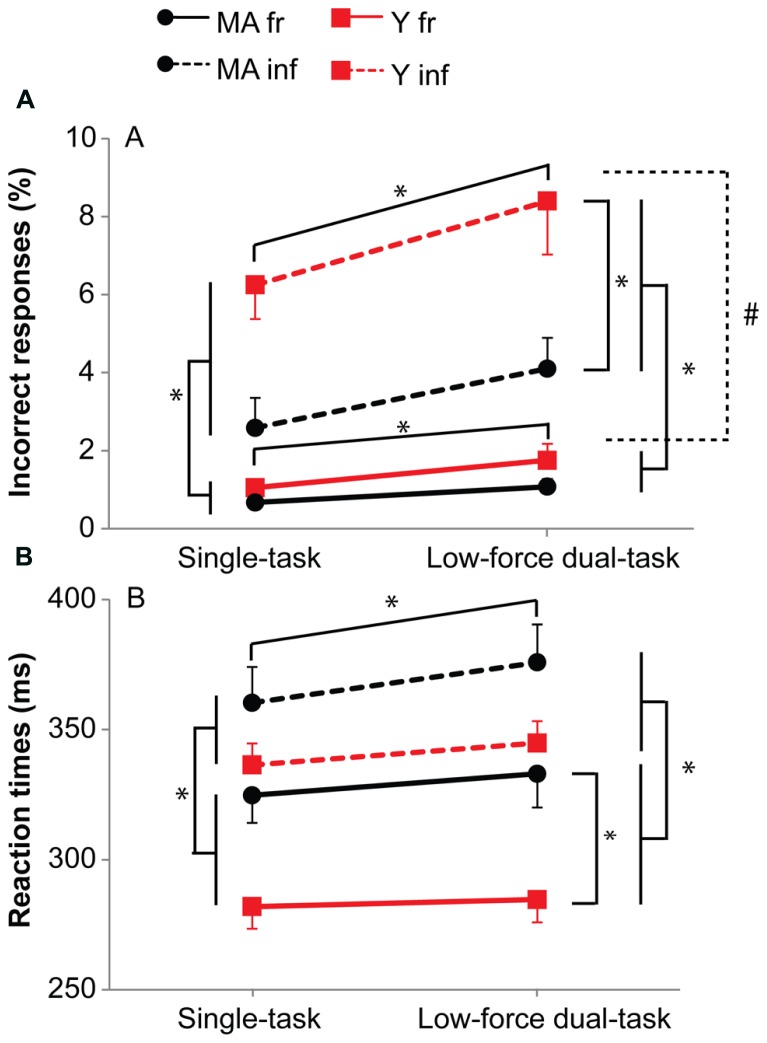
FIGURE 4.
Accuracy (A) and reaction times (B) for the single and 10%-dual-task (10% MVC). Black circles represent middle-aged subjects, red squares represent young subjects. Solid lines for frequent stimuli, dashed lines for infrequent stimuli. Error bars represent SE. * shows main effects, # shows interaction effects. The graphs shows the difference between the two age groups with respect to preparation, i.e., faster reaction times for the frequent stimuli, but larger number of errors for the infrequent stimuli especially for the young subjects.

