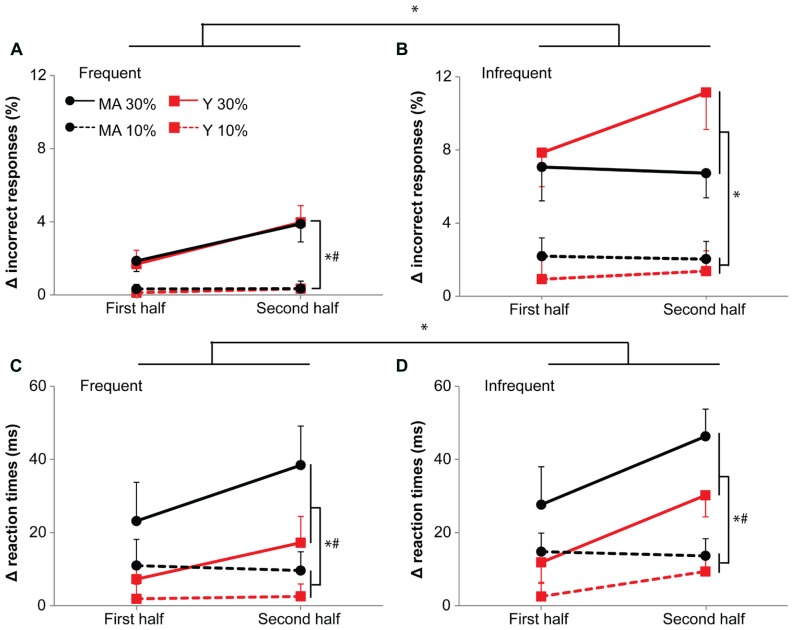
FIGURE 6.
Accuracy (A,B) and reaction times (C,D) during the 10 and 30%-dual-task. (A,C) Show responses to frequent stimuli, (B,D) responses to infrequent stimuli. Data is represented as the difference between dual-task and single-task (delta). Black circles represent middle-aged subjects, red squares represent young subjects. Solid lines for 30%-dual-task (30% cMVC), dashed lines for 10%-dual-task (10% cMVC). Data are shown for the first and second half of the task. Error bars represent SE. * shows main effects, # shows interaction effects. Please note the increase in errors (see, however; middle-aged subjects on infrequent stimuli) and reaction times with time for the 30%-dual-task.

