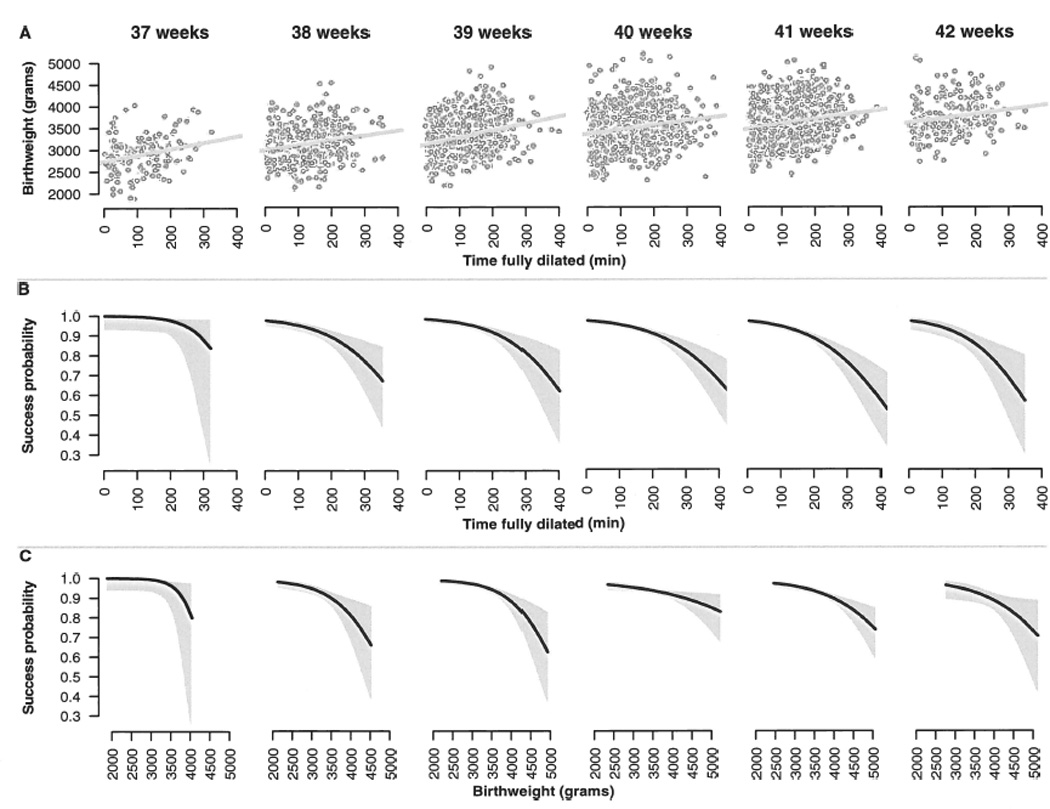
Figure 2.

Panel A: Scatterplot and least-squares fit for birth weight versus time fully dilated, stratified by gestational age. Panels B and C: Estimated probability of successful instrumental delivery versus time fully dilated (B) and birth weight (C), stratified by gestational age. The black line shows the logistic-regression estimate; the grey area, a 95% confidence interval.
