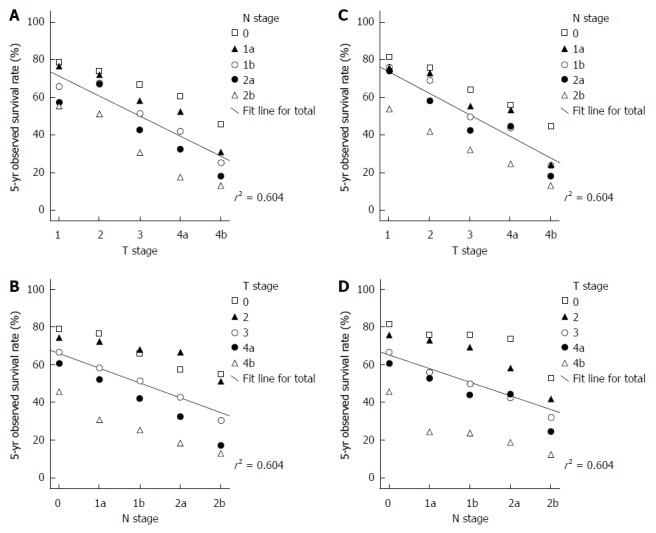
Figure 2.

Scatter plots for T stage, N stage and the 5-year observed survival of colorectal cancer patients. A: Highlight of the T stage of colon cancer; B: Highlight of the N stage of colon cancer; C: Highlight of the T stage of rectal cancer; D: Highlight of the N stage of rectal cancer.
